Deere & Co Up Over 8% After 1Q Earnings Report -- Data Talk
February 21 2020 - 11:32AM
Dow Jones News
Deere & Company (DE) is currently at $179.14, up $13.31 or
8.03%
-- Would be highest close since Nov. 11, 2019, when it closed at
$179.80
-- On pace for largest percent increase since Nov. 23, 2016,
when it rose 11.04%
-- Earlier Friday, Deere & Company reported first-quarter
net sales of $6.53 billion, down 6% from a year earlier, but ahead
of the $6.22 billion analysts polled by FactSet had projected. Net
income for the quarter was $517 million, or $1.63 a share, compared
with $498 million, or $1.54 a share. Analysts expected $1.27 a
share
-- Currently up two consecutive days; up 8.62% over this
period
-- Best two day stretch since the two days ending Nov. 25, 2016,
when it rose 12.94%
-- Up 12.97% month-to-date
-- Up 3.4% year-to-date
-- Down 0.37% from its all-time closing high of $179.80 on Nov.
11, 2019
-- Up 7.94% from 52 weeks ago (Feb. 22, 2019), when it closed at
$165.97
-- Down 0.37% from its 52 week closing high of $179.80 on Nov.
11, 2019
-- Up 32.88% from its 52 week closing low of $134.82 on May 17,
2019
-- Traded as high as $181.99; new all-time intraday high (Based
on available data back to Jan. 21, 1972)
-- Up 9.74% at today's intraday high; largest intraday percent
increase since Nov. 23, 2016, when it rose as much as 11.4%
-- Best performer in the S&P 500 today
All data as of 10:54:56 AM
Source: Dow Jones Market Data, FactSet
(END) Dow Jones Newswires
February 21, 2020 11:17 ET (16:17 GMT)
Copyright (c) 2020 Dow Jones & Company, Inc.
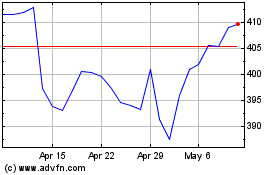
Deere (NYSE:DE)
Historical Stock Chart
From Mar 2024 to Apr 2024

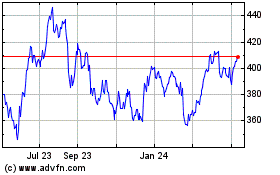
Deere (NYSE:DE)
Historical Stock Chart
From Apr 2023 to Apr 2024
