Morgan Stanley Up Nearly 6%, Best Performer in S&P 500 So Far Today -- Data Talk
January 16 2020 - 10:44AM
Dow Jones News
Morgan Stanley (MS) is currently at $56.10, up $3.16 or
5.96%
-- Would be highest close since March 21, 2018, when it closed
at $57.11
-- On pace for largest percent increase since Dec. 26, 2018,
when it rose 6.19%
-- Earlier Thursday, Morgan Stanley reported fourth-quarter
profit rose 46% from a year ago, capping off the bank's best year
on record. The firm's profit of $2.2 billion, or $1.30 a share, on
$10.9 billion in revenue, topped expectations of analysts polled by
FactSet, who had forecast earnings of $1.02 a share on $9.71
billion of revenue
-- The firm is aiming for a return on tangible equity of 13% to
15% by 2021 and as high as 17% in the future, which today make it
one of the country's most profitable big banks. The figure was
12.9% for 2019 excluding one-time tax benefits
-- Currently up seven consecutive days; up 10.16% over this
period
-- Longest winning streak since Oct. 23, 2019, when it rose for
11 straight trading days
-- Best seven day stretch since the seven days ending Jan. 4,
2019, when it rose 11.59%
-- Up 9.73% month-to-date
-- Down 38.32% from its all-time closing high of $90.95 on Sept.
11, 2000
-- Would be a new 52-week closing high
-- Traded as high as $56.94; highest intraday level since March
21, 2018, when it hit $58.17
-- Up 7.56% at today's intraday high; largest intraday percent
increase since Nov. 9, 2016, when it rose as much as 8.24%
-- Best performer in the S&P 500 today
-- Second most active stock in the S&P 500 today
All data as of 10:07:11 AM
Source: Dow Jones Market Data, FactSet
(END) Dow Jones Newswires
January 16, 2020 10:29 ET (15:29 GMT)
Copyright (c) 2020 Dow Jones & Company, Inc.
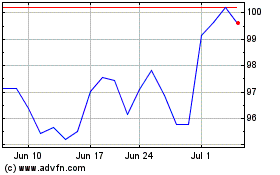
Morgan Stanley (NYSE:MS)
Historical Stock Chart
From Mar 2024 to Apr 2024

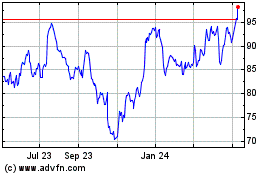
Morgan Stanley (NYSE:MS)
Historical Stock Chart
From Apr 2023 to Apr 2024
