AABB PPS Set To Rise From $0.01 To $0.10 And Beyond With Gold Heading To $2000
July 08 2019 - 9:39AM
InvestorsHub NewsWire
AABB PPS Set To Rise From $0.01 To
$0.10 And Beyond With Gold Heading To $2000

July 8, 2019 -- InvestorsHub NewsWire -- via www.nextbigticker.com
Asia Metals Inc. (USOTC:
AABB) just published news on its Phase II Gold Mine Drill
Program on a historical and verified mine in conjunction with Gold
Prices recently reaching a 6 year
high.
“In January of this year, the Company's
management and technical team were ecstatic with the successful
drill results from the Phase I Program. The highlights of the drill
results revealed high grade gold mineralization that attested the
mine's historical production to date. The most significant gold
value intersections were 3.1 meters (m) graded at 10.9 grams per
ton (g/t), 4.8 meters (m) graded at 8.7 grams per ton (g/t) and
14.2 meters (m) graded at 5.7 grams per ton
(g/t).
At the same time Asia Metals initiates its
Phase II program, Gold Prices have recently gone to 6-year highs
against all major currencies. Gold bullion prices have climbed
in the wholesale market to touch $1438 per ounce – the
highest since May 2013.”
Today CNBDC published a report indicating
Gold Prices are set to go even
higher.
CNBC - Gold prices could reach $2,000 by the end of
the year, strategist
says
AABB is trading at $0.01 and has a 52 week
high over $0.10. The company recently reported over 1000%
annual revenue growth to $3.8 million and then subsequently
reported over $1.2 million in revenue in the first quarter
following its annual report. AABB looks to be entering a
strong period of growth and could easily return to its 52 week
$0.10 high.
Puration, Inc. (USOTC:
PURA), Kali, Inc, (USOTC:
KALY) and Hemp, Inc. (USOTC:
HEMP) are also showing strong bullish trends and are worth
watching.
Disclaimer:
NextBigTicker.com (NBT)is a third party
publisher and news dissemination service provider. NBT is NOT
affiliated in any manner with any company mentioned herein. NBT is
news dissemination solutions provider and are NOT a registered
broker/dealer/analyst/adviser, holds no investment licenses and may
NOT sell, offer to sell or offer to buy any security. NBT's
market updates, news alerts and corporate profiles are NOT a
solicitation or recommendation to buy, sell or hold securities. The
material in this release is intended to be strictly informational
and is NEVER to be construed or interpreted as research material.
All readers are strongly urged to perform research and due
diligence on their own and consult a licensed financial
professional before considering any level of investing in
stocks. All material included herein is republished content
and details which were previously disseminated by the companies
mentioned in this release or opinion of the writer. NBT is not
liable for any investment decisions by its readers or subscribers.
Investors are cautioned that they may lose all or a portion of
their investment when investing in stocks. NBT has not been
compensated for this release and HOLDS NO SHARES OF ANY
COMPANY NAMED IN THIS RELEASE.
Disclaimer/Safe
Harbor:
This news release contains forward-looking
statements within the meaning of the Securities Litigation Reform
Act. The statements reflect the Company's current views with
respect to future events that involve risks and uncertainties.
Among others, these risks include the expectation that any of the
companies mentioned herein will achieve significant sales, the
failure to meet schedule or performance requirements of the
companies' contracts, the companies' liquidity position, the
companies' ability to obtain new contracts, the emergence of
competitors with greater financial resources and the impact of
competitive pricing. In the light of these uncertainties, the
forward-looking events referred to in this release might not
occur.
Source: www.nextbigticker.com
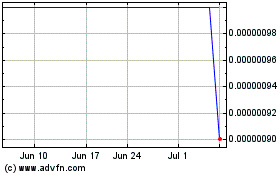
Hemp (CE) (USOTC:HEMP)
Historical Stock Chart
From Mar 2024 to Apr 2024

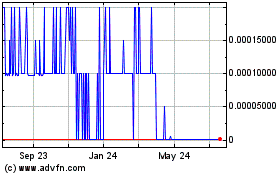
Hemp (CE) (USOTC:HEMP)
Historical Stock Chart
From Apr 2023 to Apr 2024
