Agilent Technologies Down Nearly 10%, on Pace for Largest Percent Decrease Since August 2011 -- Data Talk
May 15 2019 - 11:49AM
Dow Jones News
Agilent Technologies Inc. (A) is currently at $68.54, down $7.48
or 9.83%
-- Would be lowest close since Jan. 8, 2019, when it closed at
$67.83
-- On pace for largest percent decrease since Aug. 18, 2011,
when it fell 9.97%
-- Earlier Wednesday, three firms cut their price target on
Agilent Technologies, Benzinga reported
-- On Tuesday, Agilent reported second-quarter net income of
$182 million, or 57 cents a share, down from $205 million, or 63
cents a share, a year ago. The company reported adjusted earnings
of 71 cents a share. Analysts polled by FactSet were expecting
earnings of 65 cents a share, or 72 cents a share on an adjusted
basis
-- Agilent lowered its revenue forecast for the current fiscal
year to between $5.09 billion and $5.13 billion, from between $5.15
billion and $5.19 billion previously
-- Down 12.69% month-to-date
-- Up 1.59% year-to-date
-- Down 36.8% from its all-time closing high of $108.43 on March
6, 2000
-- Up 10.65% from 52 weeks ago (May 16, 2018), when it closed at
$61.94
-- Down 16.42% from its 52 week closing high of $82.00 on March
21, 2019
-- Up 12.11% from its 52 week closing low of $61.13 on Oct. 24,
2018
-- Worst performer in the S&P 500 today
All data as of 11:09:49 AM
Source: Dow Jones Market Data, FactSet
(END) Dow Jones Newswires
May 15, 2019 11:34 ET (15:34 GMT)
Copyright (c) 2019 Dow Jones & Company, Inc.
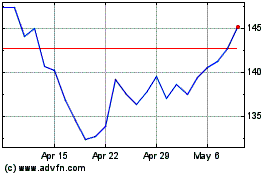
Agilent Technologies (NYSE:A)
Historical Stock Chart
From Mar 2024 to Apr 2024

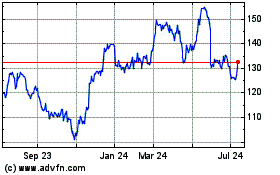
Agilent Technologies (NYSE:A)
Historical Stock Chart
From Apr 2023 to Apr 2024
