Corporate Bonds Mostly Weather Storm as Stocks, Treasury Yields Fall
March 22 2019 - 2:55PM
Dow Jones News
By Sam Goldfarb
Friday's downturn in stock prices is having some modest
spillover effects in the corporate-bond market as traders react to
falling Treasury yields and the latest bad economic data out of
Europe.
The decline in Treasury yields is putting particular pressure on
bank bonds given the potential for low yields to shrink lenders'
net interest margins, traders said.
A Citigroup Inc. 4.075% note due 2029 recently traded with an
excess yield, or spread, to U.S. Treasurys of 1.33 percentage
points, according to Market Axess, up from 1.29 percentage points
Thursday. The spread on a 10-year Bank of America Corp. bond also
ticked up as much as 0.03 percentage point to 1.33 percentage
points, though it stood at 1.31 percentage point in recent trading.
Shares of Citigroup were down 4.4% and Bank of America was down
3.9% Friday afternoon.
Lower down the credit spectrum, some newly issued
speculative-grade bonds were trading down roughly 0.5 cents on the
dollar, reflecting the reduced appetite for riskier assets among
investors.
The moves were more significant when measured against government
bonds, given Friday's sharp decline in Treasury yields prompted by
weak German manufacturing data.
While Tesla Inc.'s 5.3% notes due 2025 were recently down just
0.25 cents on the dollar, their extra yield over Treasurys at one
point Friday jumped to 5.99 percentage points -- their highest on
record -- from 5.83 percentage points Thursday, according to
MarketAxess.
Prior to Friday, corporate bond investors have held a relatively
optimistic outlook on the U.S. economy. The average
speculative-grade bond spread was just 3.8 percentage points
Thursday, down from 5.26 percentage points at the end of last year,
according to Bloomberg Barclays data.
That benign market backdrop has allowed companies to sell nearly
$57 billion of speculative-grade bonds in the U.S. so far this year
after issuing less than $15 billion of bonds in the last three
months of 2018, according to LCD, a unit of S&P Global Market
Intelligence.
Write to Sam Goldfarb at sam.goldfarb@wsj.com
(END) Dow Jones Newswires
March 22, 2019 14:40 ET (18:40 GMT)
Copyright (c) 2019 Dow Jones & Company, Inc.
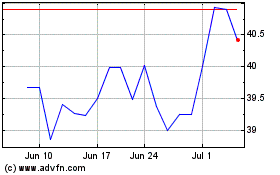
Bank of America (NYSE:BAC)
Historical Stock Chart
From Mar 2024 to Apr 2024

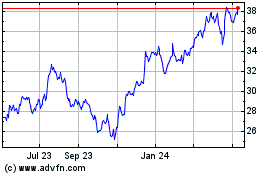
Bank of America (NYSE:BAC)
Historical Stock Chart
From Apr 2023 to Apr 2024
