Taking Toll of Tech's Tumble
November 18 2018 - 12:29PM
Dow Jones News
By Michael Wursthorn
Wall Street has been souring since October on one of the year's
most popular trades, sparking a selloff that has erased roughly
$575 billion in market value from Facebook Inc., Amazon.com Inc.,
Apple Inc., Netflix Inc. and Google parent Alphabet Inc. The
quintet -- commonly known as the FAANG stocks -- has suffered steep
losses as investors rethink their lofty valuations and projected
growth in the months ahead. But their combined market cap still
totals nearly $3 trillion, giving them considerable heft in the
S&P 500 index.
-- Facebook is the worst-performing stock of the FAANG group,
shedding 21% so far this year, amid questions over its handling of
user data. Losses have been mounting since July, when the
social-networking firm warned about slowing growth, putting
Facebook on pace for its worst year since going public in 2012.
-- Amazon.com posted its second straight quarter of record
profitability last month, but slowing revenue growth spooked
investors, sending shares down 20% in October alone.
-- The selloff robbed Apple of its $1 trillion market cap,
leaving it dangerously close to entering bear-market territory,
marked by a fall of at least 20% from a recent high. The iPhone
maker's losses have accelerated since the beginning of the month,
when Apple offered investors a tepid revenue forecast for the
current quarter.
-- Netflix had been one of the best-performing stocks in the
S&P 500 throughout the first half of the year, avoiding some of
the volatility that rattled other tech giants in the early spring.
But the video-streaming company reported weaker-than-expected
subscriber growth in July, kicking off a decline that accelerated
in October.
-- Alphabet also has shown signs of slowing growth, stirring
further angst among investors over tech's durability during an
economic slowdown. The search-engine giant has suffered a bruising
period after reporting a surging profit on slowing growth in sales,
setting up shares of Alphabet for their weakest year since
2014.
Write to Michael Wursthorn at Michael.Wursthorn@wsj.com
(END) Dow Jones Newswires
November 18, 2018 12:14 ET (17:14 GMT)
Copyright (c) 2018 Dow Jones & Company, Inc.
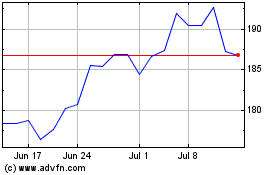
Alphabet (NASDAQ:GOOG)
Historical Stock Chart
From Mar 2024 to Apr 2024

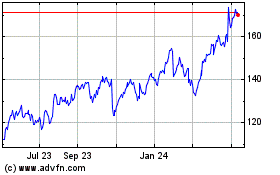
Alphabet (NASDAQ:GOOG)
Historical Stock Chart
From Apr 2023 to Apr 2024
