PG&E Down Over 17%, on Pace for Largest Decrease Since August 2002 -- Data Talk
November 12 2018 - 12:16PM
Dow Jones News
PG&E Corp. (PCG) is currently at $33.08, down $6.84 or
17.13%
-- Would be lowest close since Oct. 22, 2008, when it closed at
$32.15
-- On pace for largest percent decrease since Aug. 1, 2002, when
it fell 29.78%
-- Investors fear PG&E Corp. and Edison International face
new costs related to the wildfires in northern and southern
California. While legislators in the state recently approved a bill
that allows utilities to try to recover costs related to fires,
Goldman Sachs analyst Michael Lapides said in a note yesterday the
law doesn't provide for cost recovery in 2018
-- Currently down four of the past five days
-- Currently down three consecutive days; down 32.21% over this
period
-- Worst three day stretch since the three days ending Aug. 5,
2002, when it fell 40.29%
-- Down 29.33% month-to-date
-- Down 26.21% year-to-date; on pace for worst year since 2002
when it fell 27.75%
-- Traded as low as $24.95; lowest intraday level since Dec. 5,
2003, when it hit $24.75
-- Down 37.5% at today's intraday low; largest intraday percent
decrease since Aug. 1, 2002, when it fell as much as 42.45%
-- Worst performer in the S&P 500 today
-- Fourth most active stock in the S&P 500 today
All data as of 11:37:08 AM
Source: Dow Jones Market Data, FactSet
(END) Dow Jones Newswires
November 12, 2018 12:01 ET (17:01 GMT)
Copyright (c) 2018 Dow Jones & Company, Inc.
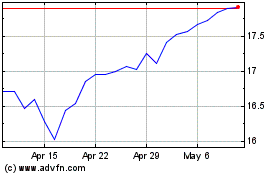
PG&E (NYSE:PCG)
Historical Stock Chart
From Mar 2024 to Apr 2024

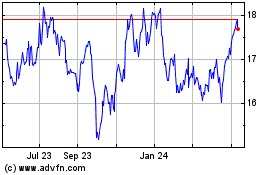
PG&E (NYSE:PCG)
Historical Stock Chart
From Apr 2023 to Apr 2024
