Report of Foreign Issuer (6-k)
May 16 2018 - 4:38PM
Edgar (US Regulatory)
Table of Contents
United States
Securities and Exchange Commission
Washington, D.C. 20549
FORM 6-K
Report of Foreign Private Issuer
Pursuant to Rule 13a-16 or 15d-16
of the
Securities Exchange Act of 1934
For the month of
May 2018
Vale S.A.
Praia de Botafogo nº 186, 18º andar, Botafogo
22250-145 Rio de Janeiro, RJ, Brazil
(Address of principal executive office)
(Indicate by check mark whether the registrant files or will file annual reports under cover of Form 20-F or Form 40-F.)
(Check One) Form 20-F
x
Form 40-F
o
(Indicate by check mark if the registrant is submitting the Form 6-K in paper as permitted by Regulation S-T Rule 101(b)(1))
(Check One) Yes
o
No
x
(Indicate by check mark if the registrant is submitting the Form 6-K in paper as permitted by Regulation S-T Rule 101(b)(7))
(Check One) Yes
o
No
x
(Indicate by check mark whether the registrant by furnishing the information contained in this Form is also thereby furnishing information to the Commission pursuant to Rule 12g3-2(b) under the Securities Exchange Act of 1934.)
(Check One) Yes
o
No
x
(If “Yes” is marked, indicate below the file number assigned to the registrant in connection with Rule 12g3-2(b). 82- .)
Premium,flexible and predictable Fabio Schvartsman, CEO Bank of America Merrill Lynch Global Metals, Mining & Steel Conference Miami, May 15th, 2018

“This presentation may include statements that present Vale's expectations about future events or results. All statements, when based upon expectations about the future and not on historical facts, involve various risks and uncertainties. Vale cannot guarantee that such statements will prove correct. These risks and uncertainties include factors related to the following: (a) the countries where we operate, especially Brazil and Canada; (b) the global economy; (c) the capital markets; (d) the mining and metals prices and their dependence on global industrial production, which is cyclical by nature; and (e) global competition in the markets in which Vale operates. To obtain further information on factors that may lead to results different from those forecast by Vale, please consult the reports Vale files with the Brazilian Comissão MarchésFinanciers U.S. Securities and Exchange de Valores Mobiliários (CVM), (AMF)andinparticularthe Commission (SEC), the the French Autorité des factorsdiscussedunder “Forward-Looking Statements” and “Risk Factors” in Vale’s annual report on Form 20-F.” “Cautionary Note to U.S. Investors - The SEC permits mining companies, in their filings with the SEC, to disclose only those mineral deposits that a company can economically and legally extract or produce. We present certain information in this presentation, including ‘measured resources,’ ‘indicated resources,’ ‘inferred resources,’ ‘geologic resources’, which would not be permitted in an SEC filing. These materials are not proven or probable reserves, as defined by the SEC, and we cannot assure you that these materials will be converted into proven or probable reserves, as defined by the SEC. U.S. Investors should consider closely the disclosure in our Annual Report on Form 20-K, which may be obtained from us, from our website or at http://http://us.sec.gov/edgar.shtml.” DAisgcelanimdear

3 Vale: a premium, flexible and predictable company • Fe “flight to quality” (pollution and productivity) • Ni Class I premium • Broad Fe and Ni product portfolio • Supply chain management - Capacity higher than production - Adjustment of lower grade production • Optionality on nickel EV Revolution • Stricter capital allocation - New dividend policy • Improved performance • Better governance • Net debt of US$ 10 billion • Sustainability in broader terms - Beyond fences - Social contribution Predictable Flexible Premium

4 “Flight to quality” is a structural trend Premiums and discounts 65%-62% 58%-62% US$/t 30 20 +US$18/t 10 0 US$ 46/t -10 -20 -US$ 28/t -30 -40 Source: Bloomberg and Mysteel until May 11th • Supply side reform • Depletion in Australia and China • Sustained world steel demand

5 Market segmentation leads to lower price volatility Platts 62% Fe prices histogram May-16 to April-17 May-17 to April-18 % of frequencies in the price bracket % of frequencies in the price bracket 47% 34% 19% 16% 40's 50's 60's 70's 80's 90's 40's 50's 60's 70's 80's 90's 1 Excluding the 5% outliers of the historical series (5% highest prices and 5% lowest prices) Prices traded in the range of US$ 40/t at 90%¹ of the times Prices traded in the range of US$ 22/t at 90%¹ of the times 1% 23% 8% 12% 41%

6 Flexible iron ore product portfolio maximizing margins Iron ore (IO) production volumes¹ Iron ore (IO) sales breakdown IO / pellets price realization gain Mtpy US$/t Northern System Nominal capacity 450 Premium products² Others Iron ore VIU and quality Pellets adjustment ~400 ~400 ~390 1Q17 4Q17 1Q18 1H17 2H17 1Q18³ 2018E 2019E 2020E 1 Including third party purchases 2 Composed by pellets, Carajás and Brazilian Blend Fines 3 Dividends received by the pelletizing plants normalized Source: Financial reports of Vale 1 230 217 200 67% 70% 76% 33% 30% 24% 3.1 1.5 5.2 4.8 2.3 1.7

7 Vale’s nickel product mix is set to capture higher premiums Nickel production volume Nickel sales breakdown Class I nickel premiums Ktpy US$/t Updated production plan1 Previous production plan Class I Class II battery-suitable Class II + Intermediates 1,390 -45 -54 -33 1Q17 4Q17 1Q18 2018E 2019E 2020E 1Q17 4Q17 1Q18 1 As presented at the Vale Day 316 308 301 263 268 262 940 730 55% 55% 63% 30% 23% 22% 22% 15% 15%

8 Constant improvements of performance Ferrous Minerals EBITDA /t Base Metals margins Coal proforma production cost2 (US$ 140 - 160 million) • S11D • Moatize and Nacala ramp-ups • Cost management program • Cost management program • Integrated planning • Supply chain optimization • Long Harbour ramp-up • Innovation and automation • VNC stabilization 1 As presented at the Vale Day 2 Production FOB cash cost (mine, plant, railway, port and royalties) of coal shipped through Nacala, excluding inventory movement, net of interest received by Vale related to shareholder loans 3 Considering 2020 costs and volumes as presented at the Vale Day vs. 2017 average proforma production cost -US$ 8 - 9/t by 20203 US$ 300 million by 2020 +US$ 3 - 5 /t by 20201 (US$ 1.2 - 2.0 bi)

9 Vale improved its corporate governance Single class of shares Dilution of control Election of two independent board members Ahead of expectations in the evolution of governance listing) (Novo Mercado

10 Shareholder value creation Slashing debt and paying higher dividend Optionality in EV market Better performance everywhere and higher price realization Sustainable iron ore premiums and discounts Lower volatility in prices Predictable

VALE

Table of Contents
Signatures
Pursuant to the requirements of the Securities Exchange Act of 1934, the registrant has duly caused this report to be signed on its behalf by the undersigned, thereunto duly authorized.
|
Date: May 15, 2018
|
Vale S.A.
|
|
|
(Registrant)
|
|
|
|
|
|
By:
|
/s/ André Figueiredo
|
|
|
|
Director of Investor Relations
|
14
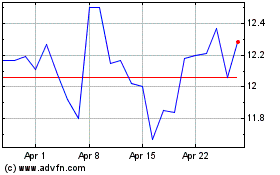
Vale (NYSE:VALE)
Historical Stock Chart
From Mar 2024 to Apr 2024

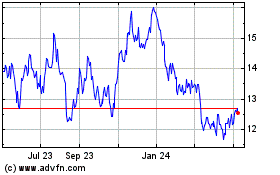
Vale (NYSE:VALE)
Historical Stock Chart
From Apr 2023 to Apr 2024
