Firms posting the best shareholder returns score in middle of
pack in terms of CEO pay
By Vanessa Fuhrmans
This article is being republished as part of our daily
reproduction of WSJ.com articles that also appeared in the U.S.
print edition of The Wall Street Journal (May 15, 2018).
The best-paid CEOs don't necessarily run the best-performing
companies.
Corporate boards have tried for years to tie chief executive
compensation to the results they deliver. The better the company
and its shareholders do, the more the top boss should be paid, or
so the pay-for-performance mantra goes. In reality, CEO pay and
performance often don't match up, and 2017 was no exception.
Among S&P 500 CEOs who got raises last year, the 10% who
received the biggest pay increases scored -- as a group -- in the
middle of the pack in terms of total shareholder return, according
to a Wall Street Journal analysis of data from MyLogIQ LLC and
Institutional Shareholder Services.
Similarly, the 10% of companies posting the best total returns
to shareholders scored in the middle of the pack in terms of CEO
pay, the data show.
"Stars are often underpaid, while average performers are often
overpaid, " said Herman Aguinis, a professor of management at
George Washington University School of Business.
One reason for the mismatch is that boards often set CEO pay by
benchmarking the average compensation for leaders at a peer group
of companies and setting performance targets accordingly, Mr.
Aguinis said. That works if CEO performance doesn't vary too
greatly from the average. But a study co-written by Mr. Aguinis and
published last week in the journal Management Research found that,
much like with professional athletes, there were vast differences
in the performance of CEOs.
The disparity between chief executive compensation and
performance appears to persist over longer periods, too, Mr.
Aguinis said. In the study, researchers analyzed the earnings of
more than 4,000 CEOs over the course of their tenures against
several performance metrics. They found virtually no overlap
between the top 1% of CEOs in terms of performance and the top 1%
of highest earners. Among the top 10% of performers, only a fifth
were in the top 10% in terms of pay.
In 2017, only two out of the 20 highest-paid CEOs who didn't
leave their jobs before the end of the year landed in the top 20
for shareholder return.
Robert Kotickof Activision Blizzard Inc., known for "Call of
Duty," "World of Warcraft" and other videogames, made $28.7 million
and posted a 76% return. Steve Wynn was paid $34.5 million, while
Wynn Resorts Ltd. posted a 98% total return. Mr. Wynn stepped down
as CEO in February amid sexual-assault allegations, which he has
denied.
Many firms condition a big share of pay on three-year
performance metrics that are only partially affected by a single
bad year, compensation consultants say.
CBS Corp. paid its chief, Leslie Moonves, $69.3 million last
year; total shareholder return was negative 6.2%. His pay was
virtually unchanged from $69.6 million in 2016 when the broadcaster
achieved a one-year return of 37%. Likewise, Comcast Corp. CEO
Brian Roberts's annual pay has hovered around $33 million the past
three years as annual shareholder returns ranged from 25% to
negative 1.1%.
In its proxy, CBS said Mr. Moonves received $12 million more in
2017 stock awards than the prior year, in part because of his
contract renewal. Comcast said in its filing that it prefers to
base executive pay on longer-term business-management metrics, not
total shareholder return.
Allergan PLC's Brent Saunders received a 700% raise in 2017 to
$32.8 million, despite total shareholder return of negative 21%.
The compensation package came during a year when Allergan ran into
patent setbacks for one of its best sellers, dry-eye drug Restasis,
which contributed to a 22% drop in the firm's share price for the
year.
Part of the $8.8 million Mr. Saunders got in incentive payments
stems from longer-term performance targets met since Allergan's
2014 acquisition of Forest Laboratories Inc., the company said in
its proxy statement. Another portion of his 2017 compensation,
$22.6 million in stock awards, won't vest until future years and is
contingent on meeting specific research and shareholder-return
goals. The drugmaker said in its proxy that because the award
covers two years, it will report less compensation for Mr. Saunders
for 2018 and 2019.
One of the biggest gaps between CEO pay and shareholder return
was at aerospace-parts company TransDigm Group Inc. For much of the
year, TransDigm's stock took a beating from short sellers who have
criticized the its acquisition-driven business model, but the
volatility had little effect on then-CEO Nicholas Howley's pay
package.
Shares, including reinvested dividends, returned just shy of 5%
for the fiscal year that ended Sept. 30, 2017, underperforming the
broader S&P 500 index for the first time in a decade. During
the same period, Mr. Howley earned $61 million, more than triple
the $18.9 million he made in 2016.
The bulk of his compensation -- $51.2 million -- came from
dividend-like payments on vested options, stemming from $46 in
special cash dividends the company awarded shareholders during the
fiscal year. TransDigm paid no dividends the previous fiscal year.
Mr. Howley also received $9.8 million in stock options. His base
salary was $7,000.
Mr. Howley stepped down in April after a 17-year run as CEO and
remains as TransDigm's executive chairman. The company declined to
comment on his pay package but pointed out that its proxy statement
shows the company's one-year return for the calendar, versus
fiscal, year was 20% and that its longer-term returns dramatically
outpace the broader market.
Write to Vanessa Fuhrmans at vanessa.fuhrmans@wsj.com
(END) Dow Jones Newswires
May 15, 2018 02:47 ET (06:47 GMT)
Copyright (c) 2018 Dow Jones & Company, Inc.
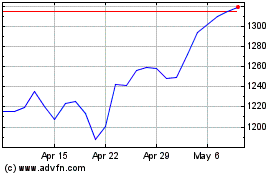
Transdigm (NYSE:TDG)
Historical Stock Chart
From Mar 2024 to Apr 2024

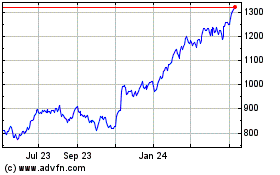
Transdigm (NYSE:TDG)
Historical Stock Chart
From Apr 2023 to Apr 2024
