Morgan Stanley Reports Higher Revenue, Earnings
April 18 2018 - 7:30AM
Dow Jones News
By Liz Hoffman
Morgan Stanley said its first-quarter profit rose 38%, following
other big Wall Street banks that got a boost from lower taxes and
more-active markets.
Morgan Stanley reported Wednesday quarterly profits of $2.67
billion, or $1.45 a share, on revenue of $11.08 billion. Both were
higher than a year ago and surpassed the average analyst estimates
of $1.25 a share in earnings and $10.36 billion in revenue,
according to Thomson Reuters.
Under Chief Executive James Gorman, Morgan Stanley is in the
late innings of a revamp designed to make its revenue more
predictable and decrease risk. It has doubled down on fee-based
wealth-management services and eased its reliance on trading
commissions and principal investment gains.
The firm in January set out new financial targets, most of which
appear easily in reach, especially given the impact of the tax
cuts.
Shares touched a 10-year high of nearly $59 in mid-March before
sliding amid stock-market turmoil and fears of an escalating trade
war. They remain up 1.5% this year, before Wednesday, and are
rising 2.3% in premarket trading following the bank's results.
Expectations had been relatively high for the quarter, given
improved results at rivals including JPMorgan Chase & Co. and
Goldman Sachs Group Inc., which reported earnings Tuesday. Wall
Street trading desks hummed as markets gyrated, while rising
interest rates boosted the value of everything from adjustable
mortgages to big corporate loans.
The market's wild ride in the first quarter aided Morgan
Stanley's stock-trading, the biggest on Wall Street by annual
revenues. JPMorgan reported a 26% year-over-year increase in
stock-trading revenues, while Citigroup Inc. and Bank of America
Corp. both reported 38% increases.
Morgan Stanley is smaller in fixed-income trading and more
geared toward bond and loan trading than the "macro" products of
currencies and interest rates, which went gangbusters early in the
period.
Write to Liz Hoffman at liz.hoffman@wsj.com
(END) Dow Jones Newswires
April 18, 2018 07:15 ET (11:15 GMT)
Copyright (c) 2018 Dow Jones & Company, Inc.
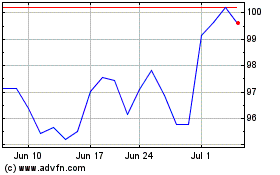
Morgan Stanley (NYSE:MS)
Historical Stock Chart
From Mar 2024 to Apr 2024

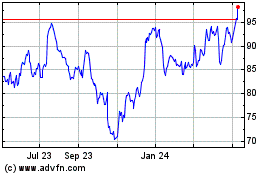
Morgan Stanley (NYSE:MS)
Historical Stock Chart
From Apr 2023 to Apr 2024
