Citi Ranks No. 1 in Global Fixed Income Market Share for Third Consecutive Year
January 25 2018 - 8:31AM
Business Wire
Leading Market Position Driven by Strength
in Credit, Rates
Citi retained its position as No. 1 in Global Fixed Income
Market Share for the third straight year, according to Greenwich
Associates’ annual benchmark study.
With a fixed-income market share topping 10 percent, Citi has
grown its share more than any other sell-side firm over the last 10
years. Citi’s leading market position is driven by its strength in
both Credit and Rates products, ranked No.1 respectively, along
with the top spot in Municipal Bonds.
“Our goal is to be the best financial services provider for our
clients, and we are grateful they have recognized us as a key
strategic partner and leader in the global fixed income market,”
said Jim O’Donnell, Global Head of Investor Sales and Relationship
Management. “Our clients are at the center of everything we do, and
we will continue to coordinate and align our efforts across the
globe to offer them unmatched innovative solutions and global
product capabilities.”
In addition to the distinction of being overall leader, Citi
also ranked No. 1 in Sales Quality, Trading Quality and e-Trading
for the third consecutive year, according to the study.
In 2017, Greenwich Associates interviewed nearly 3,500
institutional investors globally. The data received was compiled
and a statistical analysis was done to produce the final
results.
Citi, the leading global bank, has approximately 200 million
customer accounts and does business in more than 160 countries and
jurisdictions. Citi provides consumers, corporations, governments
and institutions with a broad range of financial products and
services, including consumer banking and credit, corporate and
investment banking, securities brokerage, transaction services, and
wealth management.
Additional information may be found at http://www.citigroup.com
| Twitter: @Citi | YouTube: http://www.youtube.com/citi | Blog:
http://blog.citigroup.com/| Facebook: http://www.facebook.com/citi
| LinkedIn: www.linkedin.com/company/citi.
View source
version on businesswire.com: http://www.businesswire.com/news/home/20180125005065/en/
CitiScott Helfman, 212-816-9241
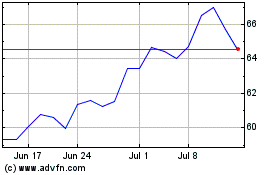
Citigroup (NYSE:C)
Historical Stock Chart
From Mar 2024 to Apr 2024

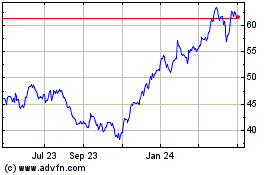
Citigroup (NYSE:C)
Historical Stock Chart
From Apr 2023 to Apr 2024
