Hit by tax charge and fixed-income falloff, bank reports $1.93
billion quarterly loss
By Liz Hoffman
This article is being republished as part of our daily
reproduction of WSJ.com articles that also appeared in the U.S.
print edition of The Wall Street Journal (January 18, 2018).
Debt traders at Goldman Sachs Group Inc. stumbled badly in the
last quarter of 2017, generating just $1 billion of revenue. Back
in 2009, they brought in that much every 10 days.
Reporting its fourth-quarter results Wednesday, Goldman said
debt-trading revenue fell 50% -- the worst three-month showing
since 2008 and the latest in a nearly unbroken chain of quarterly
declines in the business.
The numbers reflect problems not unique to Goldman, whose
struggles have been acute, but also a wider malaise that has
settled over Wall Street's securities operations, once the source
of fat profits.
The trouble isn't rogue traders or big bets gone bad, but
shrinking demand from investors who, with little conviction about
how to play the markets, simply sit it out or opt for cheap,
off-the-shelf investment products, such as index funds.
Meanwhile, new regulations have cast banks as mere toll-takers,
and more transparent and accessible data have eroded the
informational edge that once gave them pricing power over their
clients.
The biggest quakes have hit banks' fixed-income divisions,
diverse operations that trade everything from sovereign debt to
precious metals to products tied to global interest rates.
Fixed-income revenue last year at the four biggest U.S. trading
banks -- Goldman, JPMorgan Chase & Co., Citigroup and Bank of
America Corp. -- fell between 6% and 30% from 2016, and remains
orders of magnitude below the peak years of the
pre-financial-crisis boom.
Goldman's trading decline sent the company's stock down 1.8%
Wednesday and ratcheted up pressure on Chief Executive Lloyd
Blankfein to fix the business that vaulted him to the top of the
firm. Mr. Blankfein, a former gold salesman, rose through Goldman's
fixed-income trading division and ran it in the mid-2000s before
being named CEO.
For 2017 as a whole, Goldman's revenue from its fixed-income
business of $5.3 billion was little more than a fifth of what it
was in 2009.
And, for the first time on record, Goldman's investment bankers,
who broker mergers and underwrite securities offerings, outearned
the firm's fixed-income traders.
Goldman's traders struggled all of last year, losing money on
oil and gas trades as well as holdings of low-rated corporate debt.
Nothing clicked in the most-recent quarter, when a continued lack
of volatility kept clients on the sidelines. Goldman cited declines
in all four of its main fixed-income businesses, which include
credit, currencies, commodities and interest rates.
Goldman executives have said they were too slow to recognize
that the effects of the financial crisis would linger as long as
they have.
Over the past two years, the firm has cut traders, trimmed
bonuses, revamped its sales network and embraced the type of
low-margin, high-volume trades it once deemed too trivial to bother
with. Another objective is to win more trading business from
corporate clients that already hire Goldman for boardroom advice
but use rivals to manage their market risks. Goldman itself has
recognized that for too long it has relied on trading revenue from
hedge funds, whose trading business is lucrative but runs hot and
cold, and too little on companies and large asset managers, which
have more predictable, simpler needs.
"We absolutely acknowledge that the business footprint and mix
we have is a consequence of choices that we made over time," Chief
Financial Officer Martin Chavez said on an analyst call Wednesday.
"We know that we need to do better." He said it would take "an
order of months" to see changes produce new profits.
Yet some tweaks, such as a 2015 reorganization of the firm's
corporate sales force, have been in place for longer, with little
to show.
"It just seems like progress should have been a lot faster than
it's been," Mike Mayo, a Wells Fargo analyst, said Wednesday.
The most recent poor quarter is likely to intensify calls for
more dramatic changes, including a shake-up of its broader trading
division's leadership. That idea has gained steam among top Goldman
executives in recent months, according to people familiar with the
discussions.
Overall, Goldman's quarterly earnings, like those of other big
banks, were muddied by the new tax law. A $4.4 billion one-time
charge wiped out the company's entire quarterly profit, producing
its first loss since 2011 of $1.93 billion. Without the charge,
Goldman's net income would have exceeded analyst expectations.
But Goldman disappointed investors by saying it would dial back
its stock-buyback plans to plow earnings instead into areas where
it thinks it can grow.
Those include steadier businesses such as consumer banking and
money management.
Both gained ground in 2017, helping to boost Goldman's full-year
revenue 5%, the best showing among big banks so far. Asset
management added $42 billion in long-term money at a time when
investors are fleeing actively managed funds, and Goldman's
fledgling consumer-lending effort wrote $2 billion in fresh loans.
But those efforts will take years to fill the roughly $15 billion
revenue hole opened by Goldman's trading woes -- if they ever
do.
For the lack of noticeable progress in Goldman's trading
turnaround, another firmwide effort is bearing fruit. A few years
ago, executives decided to make a play for debt-underwriting
business. That business historically has been dominated by big
commercial banks, which can write large checks and tap trillions of
dollars in low-cost deposits to fund them.
Debt-underwriting revenue hit a record $2.5 billion for the year
and in the fourth quarter surpassed that of JPMorgan, Bank of
America and Citigroup. Goldman has made inroads on the back of its
merger bankers, who are more often offering debt, in addition to
advice, when putting together deals.
Write to Liz Hoffman at liz.hoffman@wsj.com
(END) Dow Jones Newswires
January 18, 2018 02:47 ET (07:47 GMT)
Copyright (c) 2018 Dow Jones & Company, Inc.
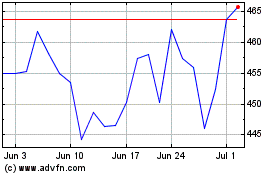
Goldman Sachs (NYSE:GS)
Historical Stock Chart
From Mar 2024 to Apr 2024

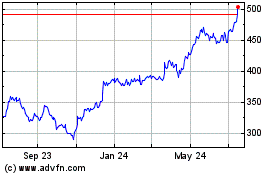
Goldman Sachs (NYSE:GS)
Historical Stock Chart
From Apr 2023 to Apr 2024
