UNITED STATES
SECURITIES AND EXCHANGE COMMISSION
Washington, D.C. 20549
FORM 6-K
Report of Foreign Private Issuer
Pursuant to Rule 13a-16 or 15d-16 under the Securities
Exchange Act of 1934
|
|
|
| For May 2017 |
|
Commission File Number: 1-34513 |
CENOVUS ENERGY INC.
(Translation of registrant’s name into English)
2600, 500 Centre Street S.E.
Calgary, Alberta, Canada T2G 1A6
(Address of principal executive office)
Indicate by check mark whether the registrant files or will file annual reports under cover of Form
20-F or Form 40-F.
Form 20-F ☐ Form 40-F ☒
Indicate by check mark if the registrant is submitting the Form 6-K in paper as permitted by
Regulation S-T Rule 101(b)(1):
Indicate by check mark if the registrant is submitting the Form 6-K in paper as permitted by
Regulation S-T Rule 101(b)(7):
DOCUMENTS FILED AS PART OF THIS FORM 6-K
See the Exhibit Index to this Form 6-K.
SIGNATURES
Pursuant to
the requirements of the Securities Exchange Act of 1934, the registrant has duly caused this report to be signed on its behalf by the undersigned, thereunto duly authorized.
Date: May 2, 2017
|
|
|
|
|
| CENOVUS ENERGY INC. |
|
|
| (Registrant) |
|
|
|
|
|
| By: |
|
/s/ Elizabeth A. McNamara |
|
|
|
|
Name: Elizabeth A. McNamara |
|
|
|
|
Title: Assistant Corporate Secretary |
|
|
Form 6-K Exhibit Index
|
|
|
| Exhibit No. |
|
|
|
|
| 99.1 |
|
Interim Report to Shareholders for the period ended March 31, 2017 |
Exhibit 99.1

Cenovus delivers strong first quarter operational performance
Acquisition of FCCL and Deep Basin assets on track
Calgary, Alberta (April 26, 2017) – Cenovus Energy Inc. (TSX: CVE) (NYSE: CVE) continued to deliver strong operational performance in the
first quarter of 2017, increasing oil sands production by almost one-third while further reducing per-barrel crude oil operating costs compared with the same period in 2016. As a result of its reduced cost structure, significant liquidity and strong
financial position, the company was also able to pursue the agreement, announced March 29, 2017, to acquire assets in Alberta and British Columbia from ConocoPhillips for approximately $17.7 billion. The agreement includes ConocoPhillips’
50% interest in the FCCL Partnership, the companies’ jointly owned oil sands venture, as well as its Deep Basin assets. The transaction, which will be immediately accretive to key performance measures, is expected to close in the second
quarter.
Acquisition update
| |
● |
|
Legacy assets at Pelican Lake and Suffield are being actively marketed |
| |
● |
|
On track with plan to integrate Deep Basin assets and staff upon closing |
| |
● |
|
Raised $3.0 billion gross proceeds through a bought-deal offering of common shares |
| |
● |
|
Closed long-term senior unsecured notes offering for US$2.9 billion gross proceeds |
Key first quarter developments
| |
● |
|
Generated adjusted funds flow of $323 million, compared with $26 million in 2016. Adjusted funds flow benefited from
higher crude oil sales prices, partially offset by about $90 million in realized hedging losses, $29 million in acquisition-related transaction costs and about $20 million related to higher crude oil inventories |
| |
● |
|
Cash from operating activities was $328 million, an 80% increase from 2016 |
| |
● |
|
Resumed field construction of the Christina Lake phase G expansion project |
| |
● |
|
Successfully drilled 252 oil wells using an average of 21 drilling rigs. This included 232 gross stratigraphic test wells
and 20 gross horizontal wells |
|
|
|
|
|
|
|
| Production & financial summary |
| (For the period ended March 31)
Production (before royalties) |
|
2017
Q1 |
|
2016
Q1 |
|
% change |
| Oil sands (bbls/d) |
|
181,501 |
|
137,975 |
|
32 |
| Conventional
oil1 (bbls/d) |
|
53,413 |
|
59,576 |
|
-10 |
| Total oil (bbls/d) |
|
234,914 |
|
197,551 |
|
19 |
| Natural gas (MMcf/d) |
|
363 |
|
408 |
|
-11 |
| Financial
($ millions, except per share2 amounts) |
|
|
|
|
|
|
| Cash from operating activities |
|
328 |
|
182 |
|
80 |
| Adjusted funds flow3 |
|
323 |
|
26 |
|
1,142 |
| Per share diluted |
|
0.39 |
|
0.03 |
|
|
| Operating earnings/loss3 |
|
-39 |
|
-423 |
|
|
| Per share diluted |
|
-0.05 |
|
-0.51 |
|
|
| Net earnings/loss |
|
211 |
|
-118 |
|
279 |
| Per share diluted |
|
0.25 |
|
-0.14 |
|
|
| Capital investment |
|
313 |
|
323 |
|
-3 |
| |
1 |
Includes natural gas liquids (NGLs). |
| |
2 |
Per share amounts exclude the impact of the bought-deal offering of
common shares which closed April 6, 2017. |
| |
3 |
Adjusted funds flow and operating earnings are non-GAAP measures.
For more information, refer to the Non-GAAP Measures section of the Advisory at the end of this quarterly report. |
|
Asset acquisition update
Since announcing its agreement to purchase the ConocoPhillips assets, Cenovus has made significant progress in executing its acquisition plan. To reduce
debt associated with the transaction and strengthen its balance sheet, the company has been marketing its legacy Pelican Lake and Suffield conventional assets with data rooms open to prospective buyers.
“These assets have attracted strong initial interest from a wide variety of potential purchasers,” said Brian Ferguson, Cenovus
President & Chief Executive Officer. “Our data rooms have been very busy, and that bodes well as we look to successfully conclude transactions to further streamline our asset portfolio, help preserve our financial resilience and
deleverage our balance sheet.”
Asset sale proceeds are expected to be applied against anticipated draws on Cenovus’s asset-sale bridge
facility and existing credit facility, which are part of the company’s acquisition financing plan. On April 6, 2017, Cenovus successfully closed a bought-deal offering of common shares with gross proceeds of $3.0 billion. In addition,
on April 7, 2017, the company completed a US$2.9 billion long-term debt offering of 4.9% (weighted average) senior unsecured notes. Cenovus has also obtained commitments from its lending syndicate to extend the maturities of its existing
credit facility tranches to 2020 and 2021 and increase the total capacity from $4.0 billion to $4.5 billion. The company expects this credit facility transaction to close later this week.
Upon closing, the acquisition will give Cenovus two attractive growth platforms in Western Canada, providing the company with enhanced opportunities to
increase total shareholder return, including assessing the optimal level of its dividend once the company’s divestiture of legacy assets is complete. If the acquisition had closed on the January 1, 2017 effective date, the transaction
would have been expected to more than double the company’s production, increasing 2017 forecast volumes by approximately 298,000 barrels of oil equivalent per day (BOE/d). After completing the transaction, Cenovus will have total combined
regulatory approval for 735,000 barrels per day (bbls/d) of production capacity at its FCCL assets, including existing operating capacity and potential capacity additions. Cenovus will also gain 1,500 potential drilling opportunities in the Deep
Basin. The acquisition is expected to be immediately accretive to key performance measures and to give Cenovus capacity to generate forecast 2018 free funds flow of approximately $500 million, net of planned asset divestitures, with West Texas
Intermediate (WTI) oil prices at US$50/bbl and New York Mercantile Exchange (NYMEX) natural gas prices at US$3 per million British thermal units (MMBtu).
If the acquisition had closed on the January 1, 2017 effective date, forecast capital investment for the year in the acquired Deep Basin assets
would have been anticipated to be approximately $170 million, with plans for increased investment levels in the following two years. The company believes these properties, which will continue to be operated by staff joining Cenovus from
ConocoPhillips, have the potential to achieve a more than 40% increase in production to average approximately 170,000 BOE/d in 2019. With this moderate amount of capital investment, these assets are expected to make a significant contribution to
increased adjusted funds flow. Additionally, the Deep Basin is expected to
|
|
|
| Cenovus Energy Inc. First Quarter 2017 Report |
|
Page 2 News
Release |
offset Cenovus’s demand for natural gas as oil sands production increases, as well as provide NGLs that could be used as solvents. The company plans to implement a solvent-aided process at
its oil sands operations to potentially enhance in-situ recovery and improve environmental and economic performance.
“With the successful completion of this transaction, we’ll have a combined portfolio of long-cycle oil sands development, complemented by the
short-cycle opportunities in the Deep Basin, which we believe will provide us with a clear line of sight to a decade of growth and value creation for our company and shareholders,” said Ferguson. “We are focused on completing this
acquisition and executing our transition plan to help ensure a smooth and timely transfer of staff and facilities to Cenovus.”
At its Investor
Day in June 2017, Cenovus intends to provide an update on its plans for Foster Creek phase H and Narrows Lake phase A, including expectations for capital efficiencies and timing for each project. Foster Creek phase H has an expected design capacity
of 30,000 bbls/d and Narrows Lake phase A has an expected design capacity of 45,000 bbls/d. The company continues to advance engineering work on the two deferred expansion projects using the same rigour that was applied to Christina Lake phase G.
Cenovus also expects to provide additional information on its plans for the new Deep Basin assets and on technologies being developed to potentially enhance operating performance across its oil sands projects.
From 2014 to 2016, Cenovus’s focus on cost efficiency and innovation led to a 30% reduction in its
per-barrel oil sands non-fuel operating costs as well as a 50% reduction in oil sands sustaining capital costs. In that same period, the company has also reduced general
and administrative (G&A) expenses per BOE by about one-third, excluding charges related to severance and office building leases in Calgary that exceed Cenovus’s current and near-term requirements.
With anticipated future cost reductions, opportunities to improve reservoir performance and the potential to develop its large portfolio of emerging assets, Cenovus expects to be well positioned at the close of the acquisition to create significant
value across a substantially larger oil sands resource and production base.
Cenovus has made all required regulatory filings in connection with the
acquisition and is awaiting the required approvals. In addition, on March 31, 2017, the Toronto Stock Exchange approved the listing of 208 million common shares to be issued to ConocoPhillips upon closing of the acquisition, subject to
customary closing conditions. The New York Stock Exchange approved the listing of such shares on April 11, 2017.
First
quarter overview
Oil production
In the first
quarter of 2017, the ramp-up of the Christina Lake phase F and Foster Creek phase G expansion projects continued as expected. Incremental volumes from the new phases contributed to first quarter oil sands
production, net to Cenovus, of more than 181,000 bbls/d, a 32% increase from the same period in 2016. The expansions increased the company’s total oil sands production capacity by 26%, or 80,000 bbls/d gross, to 390,000 bbls/d gross. The new 100-megawatt natural gas fired cogeneration plant at
|
|
|
| Cenovus Energy Inc. First Quarter 2017 Report |
|
Page 3 News
Release |
Christina Lake, which provides reliable, energy-efficient power to the project, completed its start up in the first quarter.
Field construction has resumed at Christina Lake phase G and is expected to ramp up through the remainder of the second quarter. The company anticipates
the expansion can be completed with go-forward capital investment of between $16,000 and $18,000 per flowing barrel. Phase G has an expected design capacity of 50,000 bbls/d gross. First oil is anticipated in
the second half of 2019. At its oil sands business, Cenovus drilled 206 gross stratigraphic test wells in the first quarter of 2017. These wells are drilled to help identify pad locations for sustaining wells and near-term expansion phases as well
as to further evaluate emerging assets.
Cenovus’s conventional oil and natural gas portfolio remains the most flexible part of its capital
investment program and with moderate spending is expected to be able to generate significant free funds flow to invest in growth opportunities. In the first quarter of 2017, the conventional portfolio generated $57 million in free funds flow.
Cenovus more than doubled capital investment in its conventional portfolio to $88 million in the first quarter of 2017 compared with a year earlier, mostly due to the company’s targeted drilling program on the Palliser Block, which is
proceeding as expected. Cenovus drilled 20 horizontal oil wells and 26 stratigraphic test wells during the first three months of the year. The completion of wells drilled in late 2016, combined with drilling in the first quarter, resulted in the
addition of approximately 1,300 bbls/d of crude oil production from the Palliser Block for the period, with incremental volumes reaching 3,300 bbls/d as of March 31. Overall, conventional oil production in the first quarter of 2017 was 53,413
bbls/d, a 10% decrease from the same period a year earlier, largely due to expected natural declines. Cenovus plans to sell a significant portion of its legacy conventional properties to help finance the company’s acquisition of the Deep Basin
and FCCL assets.
Cost reductions
Cenovus continued to
achieve additional operating cost and sustaining capital reductions in the first quarter of 2017. Oil sands operating costs were $8.97/bbl in the first quarter, a 6% decrease from the same period a year earlier, while
non-fuel oil sands operating costs were $6.23/bbl, a 15% decline. At Cenovus’s conventional assets, despite expected production declines, per-unit liquids operating
costs continued to improve, declining 2% to $14.47/bbl compared with the first quarter of 2016. G&A costs declined 28% compared with the first quarter of 2016, mostly as a result of lower expenses associated with Cenovus’s employee
long-term incentives and its Calgary real estate commitments.
Financial performance and resilience
In the first quarter of 2017, Cenovus generated adjusted funds flow of $323 million, compared with $26 million in 2016. Adjusted funds flow
improved due to the nearly three-fold increase in Cenovus’s crude oil sales price and higher refining and marketing operating margins compared with 2016. This was partially offset by about $90 million in realized hedging losses,
$29 million in transaction costs related to the acquisition and approximately $20 million related to linefill inventory for additional pipeline takeaway capacity from Christina Lake and oil held in storage. Cash from operating activities
increased 80% to $328 million from the same period in 2016. Cenovus’s average crude oil sales price was $41.41/bbl in the first quarter, up from $15.97/bbl in the same period of 2016. Cenovus
|
|
|
| Cenovus Energy Inc. First Quarter 2017 Report |
|
Page 4 News
Release |
had a companywide netback of $19.11/BOE on its crude oil and natural gas production in the first quarter of 2017 compared with a loss of $0.12/BOE in the year earlier period.
Cenovus has an active hedging program to support cash outflows and to help maintain financial resilience. As of April 25, 2017, the company had
hedges in place on approximately 87,500 bbls/d of crude oil for the remainder of this year at an average floor price of US$49.20/bbl and 50,000 bbls/d of crude oil hedged for the first half of 2018 with an average floor price of US$49.74/bbl. To
further support Cenovus’s financial resilience while the asset sale bridge loan remains outstanding, the company plans to hedge a greater percentage of forecast liquids and natural gas volumes, allowing increased certainty on a greater portion
of expected cash outflows.
|
|
|
|
|
| Current hedge positions for 2017 |
|
Hedges at April 25, 2017 |
|
Volume |
|
Price |
| Crude – WTI Fixed Price
January - June |
|
70,000 bbls/d |
|
US$46.35/bbl |
| Crude – Brent Fixed Price
July – December |
|
44,000 bbls/d |
|
US$55.78/bbl |
| Crude – WTI Collars
July - December |
|
50,000 bbls/d |
|
US$44.84/bbl - US$56.47/bbl |
| Crude – Brent - WTI Spread
July - December |
|
50,000 bbls/d |
|
US$(1.88)/bbl |
|
|
|
|
|
| Current hedge positions for 2018 |
|
Hedges at April 25, 2017 |
|
Volume |
|
Price |
| Crude – Brent Collars
January - June |
|
30,000 bbls/d |
|
US$49.78/bbl - US$62.08/bbl |
| Crude – Brent Fixed Price
January - June |
|
10,000 bbls/d |
|
US$54.06/bbl |
| Crude – WTI Collars
January - June |
|
10,000 bbls/d |
|
US$45.30/bbl - US$62.77/bbl |
First quarter details
Oil sands
Foster Creek
| |
● |
|
Production averaged 80,866 bbls/d net in the first quarter of 2017, 33% more than in the same period of 2016, due to
incremental crude oil volumes from the phase G expansion and additional wells being brought online. |
| |
● |
|
Operating costs declined 17% to $9.99/bbl in the first quarter from the same period the previous year. Non-fuel operating costs were $7.06/bbl, a 26% decrease from the first quarter of 2016. |
| |
● |
|
The steam to oil ratio (SOR), the amount of steam needed to produce one barrel of oil, was 2.5 in the first quarter of
2017 compared with 3.0 in the same period of 2016. |
|
|
|
| Cenovus Energy Inc. First Quarter 2017 Report |
|
Page 5 News
Release |
Christina Lake
| |
● |
|
In the first quarter, production averaged 100,635 bbls/d net, a 31% increase from the same period in 2016, largely due
to the start-up of expansion phase F, which began contributing volumes in late 2016, and continued reliable facility performance. |
| |
● |
|
Operating costs were $8.08/bbl, a 6% increase from the first quarter a year earlier.
Non-fuel operating costs were $5.51/bbl, down 2% from a year ago. |
| |
● |
|
The SOR was 1.8 in the first quarter of 2017 compared with 1.9 a year earlier. |
Conventional oil
| |
● |
|
Total conventional oil production decreased 10% to 53,413 bbls/d in the first quarter of 2017 compared with the same
period the previous year, primarily due to expected natural reservoir declines. |
| |
● |
|
Liquids operating costs were $14.47/bbl in the first quarter of 2017, 2% lower than the same period a year earlier. This
was primarily the result of lower chemical costs due to more efficient use, decreased repairs, maintenance and workovers, a decline in waste fluid handling and trucking costs, lower electricity costs due to reduced consumption, and decreased
workforce costs. |
Natural gas
| |
● |
|
Natural gas production averaged 363 million cubic feet per day (MMcf/d) in the first quarter of 2017, down 11% from
the same period a year earlier, primarily due to expected natural declines. |
| |
● |
|
Per-unit operating costs increased 9% to $1.34 per thousand cubic feet (Mcf) in
the first quarter of 2017 largely due to reduced output compared with the same period in 2016. |
Downstream
| |
● |
|
The Wood River Refinery in Illinois and Borger Refinery in Texas, which Cenovus jointly owns with the operator, Phillips
66, processed a combined average of 406,000 bbls/d gross of oil (88% utilization) in the first quarter of 2017, compared with 435,000 bbls/d gross in the year earlier period (95% utilization). |
| |
● |
|
The refineries’ financial performance in the first quarter of 2017 improved compared with the same period a year
earlier. The improvement was mostly due to a 20% increase in the average 3-2-1 Chicago market crack spread, which was partially offset by lower crude oil runs and
refined product output due to planned turnarounds. |
| |
● |
|
Cenovus had refining and marketing operating margin of $53 million in the quarter, compared with a shortfall of
$23 million in the same period of 2016. The company’s refining operating margin is calculated on a first-in, first-out (FIFO) inventory accounting basis. Using
the last-in, first-out (LIFO) accounting method employed by most U.S. refiners, Cenovus’s operating margin from refining and marketing would have been
$44 million lower in the quarter. In the first quarter of 2016, operating margin would have been $37 million higher on a LIFO reporting basis. |
|
|
|
| Cenovus Energy Inc. First Quarter 2017 Report |
|
Page 6 News
Release |
Financial
Corporate and financial information
| |
● |
|
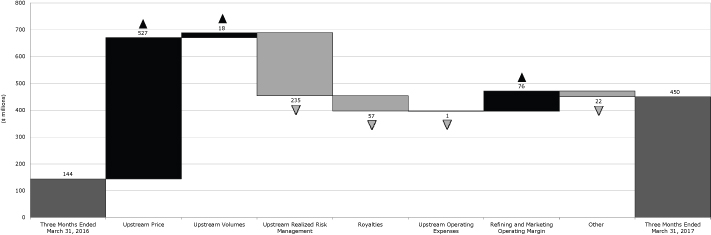
Operating margin was $450 million in the first quarter of 2017, a three-fold increase from the same period in 2016,
largely due to higher commodity prices, higher operating margin from refining and marketing and an 11% increase in crude oil sales. The increase in operating margin was partially offset by realized risk management losses of $90 million,
excluding refining and marketing, compared with gains of $145 million in the first quarter of 2016, a rise in transportation and blending expenses largely due to increased condensate prices and higher consumption, as well as higher royalties.
|
| |
● |
|
Cash from operating activities and adjusted funds flow increased largely due to higher operating margin.
|
| |
● |
|
Cenovus had free funds flow of $10 million, compared with a free funds flow shortfall of $297 million a year
earlier. |
| |
● |
|
The company’s operating loss was $39 million in the first quarter of 2017 compared with a loss of
$423 million in the same period a year earlier. The improvement was primarily due to an increase in cash from operating activities and adjusted funds flow, a decline in depreciation, depletion and amortization (DD&A) due to a
$170 million impairment recorded in the first quarter of 2016, and a lower non-cash expense recorded for office space in excess of Cenovus’s current and near-term needs. |
| |
● |
|
Cenovus had net earnings of $211 million in the first quarter of 2017. This compares with a net loss of
$118 million in the same period a year earlier when benchmark crude oil prices fell to a 13-year low. |
| |
● |
|
G&A costs were $43 million in the first quarter of 2017, down from $60 million in the same period of 2016.
The decline in G&A costs was related to reduced long-term employee incentive costs primarily due to a lower share price. G&A costs also included an $8 million non-cash expense related to office
building leases in Calgary that exceed Cenovus’s current and near-term requirements, compared with a $14 million non-cash expense in the first quarter of 2016. |
| |
● |
|
The company ended the first quarter of 2017 with cash and cash equivalents of approximately $3.5 billion as well as
$4.0 billion in undrawn capacity under its committed credit facility and no debt maturities until the fourth quarter of 2019. At the end of the first quarter, Cenovus’s net debt to capitalization was 19% compared with 16% a year ago. The
company’s net debt to adjusted earnings before interest, taxes, depreciation and amortization (EBITDA) was 1.6 times on a trailing 12-month basis compared with 1.3 times a year earlier.
|
| |
● |
|
For the second quarter of 2017, the Board of Directors has declared a dividend of $0.05 per share, payable on
June 30, 2017 to common shareholders of record as of June 15, 2017. Based on the April 25, 2017 closing share price on the Toronto Stock Exchange of $14.26, this represents an annualized yield of about 1.4%. Declaration of dividends
is at the sole discretion of the Board and will continue to be evaluated on a quarterly basis. |
|
|
|
| Cenovus Energy Inc. First Quarter 2017 Report |
|
Page 7 News
Release |
MANAGEMENT’S DISCUSSION AND ANALYSIS
This Management’s Discussion and
Analysis (“MD&A”) for Cenovus Energy Inc. (which includes references to “we”, “our”, “us”, “its”, or “Cenovus”, mean Cenovus Energy Inc., the subsidiaries of, and partnership interests
held by, Cenovus Energy Inc. and its subsidiaries) dated April 25, 2017, should be read in conjunction with our March 31, 2017 unaudited interim Consolidated Financial Statements and accompanying notes (“interim Consolidated
Financial Statements”), the December 31, 2016 audited Consolidated Financial Statements and accompanying notes (“Consolidated Financial Statements”) and the December 31, 2016 MD&A (“annual MD&A”). All of
the information and statements contained in this MD&A are made as of April 25, 2017, unless otherwise indicated. This MD&A provides an update to our annual MD&A and contains forward-looking information about our current
expectations, estimates, projections and assumptions. The information in this MD&A, as it relates to our operations for the three months ended March 31, 2017, does not reflect the closing of the Acquisition (as defined in this MD&A).
See the Transformational Acquisition section of this MD&A for more details. See the Advisory for information on the risk factors that could cause actual results to differ materially and the assumptions underlying our forward-looking information.
Cenovus Management prepared the MD&A. The interim MD&As are approved by the Audit Committee of the Cenovus Board of Directors (the “Board”) and the annual MD&A is reviewed by the Audit Committee and recommended for its approval
by the Board. Additional information about Cenovus, including our quarterly and annual reports, the Annual Information Form (“AIF”) and Form 40-F, is available on SEDAR at sedar.com, on EDGAR at
sec.gov, and on our website at cenovus.com. Information on or connected to our website, even if referred to in this MD&A, does not constitute part of this MD&A.
Basis of Presentation
This MD&A and the Consolidated
Financial Statements and comparative information have been prepared in Canadian dollars, except where another currency has been indicated, and in accordance with International Financial Reporting Standards (“IFRS” or “GAAP”) as
issued by the International Accounting Standards Board (“IASB”). Production volumes are presented on a before royalties basis.
Non-GAAP Measures and Additional Subtotals
Certain financial measures in this document do not have a
standardized meaning as prescribed by IFRS, such as Netbacks, Adjusted Funds Flow, Operating Earnings, Free Funds Flow, Debt, Net Debt, Capitalization and Adjusted Earnings Before Interest, Taxes, Depreciation and Amortization (“Adjusted
EBITDA”) and therefore are considered non-GAAP measures. In addition, Operating Margin is considered an additional subtotal found in note 1 of our interim Consolidated Financial Statements. These measures
may not be comparable to similar measures presented by other issuers. These measures have been described and presented in order to provide shareholders and potential investors with additional measures for analyzing our ability to generate funds to
finance our operations and information regarding our liquidity. This additional information should not be considered in isolation or as a substitute for measures prepared in accordance with IFRS.
The definition and reconciliation, if applicable, of each non-GAAP measure or additional subtotal is presented
in the Financial Results, Operating Results, Liquidity and Capital Resources, or Advisory sections of this MD&A.
OVERVIEW OF CENOVUS
We are a Canadian integrated oil company
headquartered in Calgary, Alberta, with our shares listed on the Toronto and New York stock exchanges. On March 31, 2017, we had an enterprise value of approximately $16 billion. We are in the business of developing, producing and
marketing crude oil, natural gas liquids (“NGLs”) and natural gas in western Canada. We conduct marketing activities and have refining operations in the United States (“U.S.”). Our average crude oil and NGLs (collectively,
“crude oil”) production for the three months ended March 31, 2017 was approximately 234,900 barrels per day and our average natural gas production was 363 MMcf per day. The refining operations processed an average of 406,000
gross barrels per day of crude oil feedstock into an average of 433,000 gross barrels per day of refined products.
Transformational Acquisition
On March 29, 2017, we announced a transformational acquisition of approximately $17.7 billion with ConocoPhillips Company and certain of its
subsidiaries (collectively, “ConocoPhillips”) to acquire ConocoPhillips’ 50 percent interest in FCCL Partnership (“FCCL”) and the majority of ConocoPhillips’ western Canadian conventional crude oil and natural gas
assets in Alberta and British Columbia (the “Acquisition”).
This Acquisition will provide us with full control over our oil sands
operations, will double our oil sands production, and almost double our proved bitumen reserves. The transaction will give us an additional growth platform with more than three million net acres of undeveloped land, exploration and production
assets, and related infrastructure in Alberta and British Columbia (collectively the “Deep Basin Assets”). The Deep Basin Assets are expected to provide complementary short-cycle development opportunities with high return potential.
Concurrent with the announcement of the Acquisition, we commenced marketing for sale certain non-core properties
to help fund the Acquisition. We plan to divest of our Pelican Lake heavy oil assets, including the adjacent Grand Rapids project in the Greater Pelican Lake region, and our Suffield crude oil and natural gas assets.
The Acquisition has an effective date of January 1, 2017 and is expected to close in the second quarter of 2017, subject to customary closing
conditions and regulatory approvals.
|
|
|
| Cenovus Energy Inc. First Quarter 2017 Report |
|
Page 8 Management’s
Discussion and Analysis |
Our Operations
Oil Sands
Our operations include steam-assisted gravity drainage (“SAGD”) oil sands projects in northern Alberta, namely Foster Creek, Christina Lake,
Narrows Lake and other emerging projects. Foster Creek and Christina Lake are producing, while Narrows Lake is in the initial stages of development. These three projects, located in the Athabasca region of northeastern Alberta, are operated by
Cenovus and jointly owned (50 percent interest) with ConocoPhillips, an unrelated U.S. public company. Our 100 percent-owned emerging project at Telephone Lake is located within the Borealis region of northeastern Alberta.
|
|
|
|
|
|
|
| |
|
Three Months Ended
March 31, 2017 |
| ($ millions) |
|
Crude Oil |
|
|
|
Natural Gas |
|
|
|
|
| Operating Margin |
|
249 |
|
|
|
1 |
| Capital Investment |
|
169 |
|
|
|
3 |
| Operating Margin Net of Related Capital Investment |
|
80 |
|
|
|
(2) |
Conventional
Crude oil production from our Conventional business segment continues to generate dependable near-term cash flows. This production provides
diversification to our revenue stream and enables further development of our oil sands assets. Our natural gas production acts as an economic hedge for the natural gas required as a fuel source at both our oil sands and refining operations and
provides cash flows to help fund our growth opportunities.
|
|
|
|
|
|
|
| |
|
Three Months Ended
March 31, 2017 |
| ($ millions) |
|
Crude Oil (1) |
|
|
|
Natural Gas |
|
|
|
|
| Operating Margin |
|
100 |
|
|
|
44 |
| Capital Investment |
|
85 |
|
|
|
3 |
| Operating Margin Net of Related Capital Investment |
|
15 |
|
|
|
41 |
We have established crude oil and natural gas producing assets, including heavy oil assets at Pelican Lake, a carbon dioxide (“CO2”) enhanced oil recovery project in Weyburn, Saskatchewan and emerging tight oil assets in Alberta.
Refining and Marketing
Our operations include two refineries located in Illinois and Texas that are jointly owned with (50 percent interest) and operated by
Phillips 66, an unrelated U.S. public company. The gross crude oil capacity at the Wood River and Borger refineries (the “Refineries”) is approximately 314,000 barrels per day and 146,000 barrels per day, respectively. The refining
operations allow us to capture the value from crude oil production through to refined products, such as diesel, gasoline and jet fuel, to partially mitigate volatility associated with regional North American light/heavy crude oil price differential
fluctuations. This segment also includes our crude-by-rail terminal operations, located in Bruderheim, Alberta, and the marketing of third-party purchases and sales of
product undertaken to provide operational flexibility for transportation commitments, product quality, delivery points and customer diversification.
|
|
|
| ($ millions) |
|
Three Months
Ended
March 31,
2017 |
| Operating Margin |
|
53 |
| Capital Investment |
|
46 |
| Operating Margin Net of Related Capital Investment |
|
7 |
|
|
|
| Cenovus Energy Inc. First Quarter 2017 Report |
|
Page 9 Management’s
Discussion and Analysis |
TRANSFORMATIONAL ACQUISITION
On March 29, 2017, we announced a
transformational acquisition of approximately $17.7 billion to acquire ConocoPhillips’ 50 percent interest in FCCL and the majority of ConocoPhillips’ western Canadian conventional crude oil and natural gas assets in Alberta and
British Columbia (the “Deep Basin Assets”). The Acquisition will provide us with full control over our oil sands operations, will double our oil sands production, and almost double our proved bitumen reserves. The Deep Basin Assets will
give us an additional growth platform with more than three million net acres of undeveloped land, exploration and production assets, and related infrastructure in Alberta and British Columbia. The Deep Basin Assets are expected to provide
complementary short-cycle development opportunities with high return potential.
Total consideration for the Acquisition, as announced on
March 29, 2017, includes US$10.6 billion in cash and 208 million Cenovus common shares (the “Consideration Shares”). To finance the cash portion of the purchase price, we:
| ● |
|
Closed a Bought-Deal Common Share Offering on April 6, 2017 for 187.5 million common shares at a price of
$16.00 per share, raising gross proceeds of $3.0 billion; |
| ● |
|
Completed an offering in the U.S. for US$2.9 billion of senior unsecured notes – US$1.2 billion
4.25 percent senior unsecured notes due April 2027, US$700 million 5.25 percent senior unsecured notes due June 2037, and US$1.0 billion 5.40 percent senior unsecured notes due June 2047. The funds from this offering (the
“Note Offering”) were placed into escrow subject to closing of the Acquisition; |
| ● |
|
Intend to borrow $3.6 billion under a committed asset sale bridge credit facility (“Bridge Facility”); and
|
| ● |
|
Anticipate the remainder of the purchase price will be funded by our existing committed credit facility and cash on hand.
|
The committed asset sale bridge credit facility consists of three tranches which mature 12 months, 18 months and 24 months,
respectively, following the Acquisition closing date. We expect to repay the committed Bridge Facility through the sale of certain assets. Concurrent with the announcement of the Acquisition, we commenced marketing for sale certain non-core properties to help fund the Acquisition. We plan to divest of our Pelican Lake heavy oil assets, including the adjacent Grand Rapids project in the Greater Pelican Lake region, and our Suffield crude oil
and natural gas assets.
As part of the Acquisition, Cenovus has agreed to make quarterly payments to ConocoPhillips during the five years subsequent
to the closing date for quarters in which the average Western Canadian Select (“WCS”) crude oil price exceeds $52.00 per barrel during the quarter. The quarterly payment will be $6 million for each dollar that the WCS price exceeds
$52.00 per barrel. The calculation includes an adjustment mechanism related to certain significant production outages at Foster Creek and Christina Lake which may reduce the amount of a contingent payment. There are no maximum payment terms. The
terms of the contingent payment agreement allow Cenovus to retain 80 percent to 85 percent of the WCS prices above $52.00 per barrel, based on current gross production capacity at Foster Creek and Christina Lake. As production capacity
increases with future expansions, the percentage of upside available to Cenovus will increase further.
The Acquisition has an effective date of
January 1, 2017 and is expected to close in the second quarter of 2017, subject to customary closing conditions and regulatory approvals. As at March 31, 2017, Cenovus has paid a deposit of US$129.5 million, which will be applied
against the Acquisition purchase price at the date of closing. We anticipate the majority of the purchase price will be allocated to acquired Property, Plant and Equipment (“PP&E”), Exploration and Evaluation (“E&E”)
assets, and goodwill.
Our material change report dated April 5, 2017, available on SEDAR and EDGAR, included forecast information outlining the
expected impacts that the Acquisition will have on our business. If forecast production from the acquired assets pertained to the full year of 2017, Cenovus would expect the Acquisition to increase Adjusted Funds Flow by 92 percent before the
impact of expected dispositions, reduce upstream operating costs per BOE by seven percent and reduce general and administrative expenses per BOE by 24 percent. In addition, Cenovus would expect the acquired assets to generate Operating Margin
of $1.8 billion for 2017 (assumes a flat US$50 per barrel WTI price throughout the year).
Before giving effect to the Acquisition, Cenovus,
through a wholly owned subsidiary, was the managing partner and jointly owned 50 percent of FCCL. FCCL met the definition of a joint operation under IFRS 11, “Joint Arrangements” and as such we recognized our share of the
assets, liabilities, revenues and expenses in our consolidated results before the business combination. Upon completion of the Acquisition, we will control FCCL, as defined under IFRS 10, “Consolidated Financial Statements” and
accordingly FCCL will be consolidated. Upon closing, the Acquisition will be accounted for using the acquisition method pursuant to IFRS 3, “Business Combinations” (“IFRS 3”). As required by IFRS 3, when an acquirer
achieves control in stages, the previously held interest is re-measured to fair value at the acquisition date with any gain or loss recognized in net earnings. At the closing date of the Acquisition, Cenovus
expects to record a non-cash revaluation gain on the re-measurement to fair value of its existing interest in FCCL.
Additional information on the Acquisition is available in our news release, dated March 29, 2017 available on SEDAR at sedar.com, on EDGAR at
sec.gov, and on our website at cenovus.com, and in our material change report dated April 5, 2017 available on SEDAR and EDGAR. The information in this MD&A, as it relates to our operations for the three months ended March 31, 2017,
does not reflect closing of the Acquisition.
|
|
|
| Cenovus Energy Inc. First Quarter 2017 Report |
|
Page 10 Management’s
Discussion and Analysis |
QUARTERLY HIGHLIGHTS
In the first quarter of 2017, the West Texas
Intermediate (“WTI”) benchmark price fluctuated between US$47 per barrel and US$54 per barrel, a significant improvement from a 13-year low of US$26 per barrel in the first quarter of 2016. As a
result, our average crude oil sales price almost tripled from the first quarter of 2016. The higher crude oil sales price, combined with a 32 percent increase in our Oil Sands production, contributed to a $329 million increase in Net
Earnings in 2017. Our companywide Netback of $19.11 per BOE in the first quarter, before realized risk management activities, was our highest quarterly Netback since the second quarter of 2015. We continued to focus on lowering our cost structure
and maintaining our financial resilience, while delivering safe and reliable operations.
In the first quarter, we:
| ● |
|
Announced a transformational Acquisition; |
| ● |
|
Increased total crude oil production by 19 percent from the first quarter of 2016, primarily due to incremental
production volumes from Foster Creek phase G and Christina Lake phase F, both of which started-up in the second half of 2016; |
| ● |
|
Almost doubled our combined Oil Sands and Conventional revenues compared with the same period in 2016, primarily related
to higher crude oil sales prices; |
| ● |
|
Decreased our per-unit crude oil operating costs by $0.81 per barrel, or seven
percent, compared with the first quarter of 2016; |
| ● |
|
Achieved Cash From Operating Activities and Adjusted Funds Flow of $328 million and $323 million, respectively,
an increase from the first quarter of 2016 of $146 million and $297 million, respectively; |
| ● |
|
Recorded Net Earnings of $211 million compared with a Net Loss of $118 million in 2016; and
|
| ● |
|
Invested $313 million in capital spending, a three percent decline from the first quarter of 2016. We will continue
to allocate capital in a disciplined manner, closely managing the pace at which we choose to invest. |
OPERATING RESULTS
Our upstream assets continued to perform well
in the first quarter of 2017. Total crude oil production increased as the planned ramp up of our expansion phases was partially offset by the expected lower production from our Conventional properties.
Crude Oil Production Volumes
|
|
|
|
|
|
|
|
|
|
|
|
|
|
|
| |
|
Three Months Ended March 31, |
| (barrels per day) |
|
2017 |
|
|
|
|
Percent
Change |
|
|
|
|
2016 |
| Oil Sands |
|
|
|
|
|
|
|
|
|
|
|
|
|
|
| Foster Creek |
|
80,866 |
|
|
|
|
|
33% |
|
|
|
|
|
60,882 |
| Christina Lake |
|
100,635 |
|
|
|
|
|
31% |
|
|
|
|
|
77,093 |
|
|
181,501 |
|
|
|
|
|
32% |
|
|
|
|
|
137,975 |
| Conventional |
|
|
|
|
|
|
|
|
|
|
|
|
|
|
| Heavy Oil |
|
27,277 |
|
|
|
|
|
(13)% |
|
|
|
|
|
31,247 |
| Light and Medium Oil |
|
25,089 |
|
|
|
|
|
(7)% |
|
|
|
|
|
27,121 |
| NGLs (1) |
|
1,047 |
|
|
|
|
|
(13)% |
|
|
|
|
|
1,208 |
|
|
53,413
|
|
|
|
|
|
(10)%
|
|
|
|
|
|
59,576
|
| Total Crude Oil Production |
|
234,914 |
|
|
|
|
|
19% |
|
|
|
|
|
197,551 |
| (1) |
NGLs include condensate volumes. |
In the first quarter of 2017, production rose at Foster Creek primarily due to incremental production volumes from the phase G expansion and additional
wells that were brought online. Production from Christina Lake increased due to incremental production volumes from the phase F expansion and reliable performance of our facilities. Ramp-up of phase G at
Foster Creek and phase F at Christina Lake is progressing as planned and is expected to be completed in the second half of 2017.
Our Conventional
crude oil production decreased from 2016 primarily due to expected natural declines.
Natural Gas Production Volumes
|
|
|
|
|
|
|
| |
|
Three Months Ended
March 31, |
| (MMcf per day) |
|
2017 |
|
|
|
2016 |
| Conventional |
|
348 |
|
|
|
391 |
| Oil Sands |
|
15 |
|
|
|
17 |
|
|
363 |
|
|
|
408 |
Our natural gas production decreased 11 percent compared with the first quarter of 2016 primarily due to expected
natural declines.
|
|
|
| Cenovus Energy Inc. First Quarter 2017 Report |
|
Page 11 Management’s
Discussion and Analysis |
Netbacks
Netback is a non-GAAP measure commonly used in the oil and gas industry to assist in measuring operating
performance on a per-unit basis. Netbacks reflect our margin on a per-barrel basis of unblended crude oil. Netback is defined as gross sales less royalties,
transportation and blending, operating expenses and production and mineral taxes divided by sales volumes. Netbacks do not reflect the non-cash write-downs of product inventory until the product is sold. The
crude oil sales price, transportation and blending costs, and sales volumes exclude the impact of purchased condensate. Condensate is blended with the heavy oil to reduce its thickness in order to transport it to market. Our Netback calculation is
aligned with the definition found in the Canadian Oil and Gas Evaluation Handbook. For a reconciliation of our Netbacks see the Advisory section of this MD&A.
|
|
|
|
|
|
|
|
|
|
|
|
|
|
|
| |
|
Crude Oil (1) ($/bbl) |
|
|
|
Natural Gas ($/Mcf) |
| |
|
Three Months Ended March 31, |
| |
|
2017 |
|
|
|
2016 |
|
|
|
2017 |
|
|
|
2016 |
| Sales Price |
|
41.41 |
|
|
|
15.97 |
|
|
|
2.99 |
|
|
|
2.31 |
| Royalties |
|
3.67 |
|
|
|
0.92 |
|
|
|
0.14 |
|
|
|
0.09 |
| Transportation and Blending |
|
5.14 |
|
|
|
5.85 |
|
|
|
0.12 |
|
|
|
0.10 |
| Operating Expenses |
|
10.27 |
|
|
|
11.08 |
|
|
|
1.34 |
|
|
|
1.23 |
| Production and Mineral Taxes |
|
0.22 |
|
|
|
0.11 |
|
|
|
0.02 |
|
|
|
- |
| Netback Excluding Realized Risk Management |
|
22.11 |
|
|
|
(1.99) |
|
|
|
1.37 |
|
|
|
0.89 |
| Realized Risk Management Gain (Loss) |
|
(4.53) |
|
|
|
8.16 |
|
|
|
- |
|
|
|
- |
| Netback Including Realized Risk Management |
|
17.58 |
|
|
|
6.17 |
|
|
|
1.37 |
|
|
|
0.89 |
Our average crude oil Netback for the first quarter of 2017, excluding realized risk management gains and losses, was substantially higher than the first
quarter of 2016. Higher sales prices, consistent with the increase in benchmark prices, and a decrease in our per unit operating costs and transportation expenses, were partially offset by the rise in royalties and the strengthening of the
Canadian dollar relative to the U.S. dollar. The strengthening of the Canadian dollar compared with 2016 had a negative impact on our crude oil price of approximately $1.55 per barrel.
Our average natural gas Netback, excluding realized risk management gains and losses, increased primarily due to higher sales prices, consistent with the
rise in the AECO benchmark price.
Refining
Crude oil runs and refined product output decreased compared with 2016 primarily due to planned turnarounds completed at both Refineries in the first
quarter of 2017. Lower heavy crude oil volumes were processed due to the planned turnarounds and optimization of the total crude input slate.
|
|
|
|
|
|
|
|
|
|
|
| |
|
Three Months Ended March 31, |
| |
|
2017 |
|
|
|
Percent
Change |
|
|
|
2016 |
|
|
|
|
|
|
| Crude Oil Runs (1)
(Mbbls/d) |
|
406 |
|
|
|
(7)% |
|
|
|
435 |
| Heavy Crude Oil (1) |
|
200 |
|
|
|
(17)% |
|
|
|
241 |
| Refined Product (1)
(Mbbls/d) |
|
433 |
|
|
|
(6)% |
|
|
|
460 |
| Crude Utilization
(1) (percent) |
|
88 |
|
|
|
(7)% |
|
|
|
95 |
| (1) |
Represents 100 percent of the Wood River and Borger refinery operations. |
In the first quarter of 2017, Refining and Marketing had an Operating Margin of $53 million compared with an Operating Margin loss of
$23 million in 2016. The rise was primarily due to an increase in our gross margin, consistent with higher average market crack spreads. The increase in Operating Margin was partially offset by a realized risk management loss compared with a
gain in 2016, a decline in crude utilization rates, a decrease in margins on the sale of secondary products, and higher operating costs.
Further
information on the changes in our production volumes, items included in our Netbacks and refining results can be found in the Reportable Segments section of this MD&A. Further information on our risk management activities can be found in the
Risk Management section of this MD&A and in the notes to the March 31, 2017 interim Consolidated Financial Statements.
|
|
|
| Cenovus Energy Inc. First Quarter 2017 Report |
|
Page 12 Management’s
Discussion and Analysis |
COMMODITY PRICES UNDERLYING OUR FINANCIAL RESULTS
Key performance drivers for our financial
results include commodity prices, price differentials, refining crack spreads as well as the U.S./Canadian dollar exchange rate. The following table shows selected market benchmark prices and the U.S./Canadian dollar average exchange rates to assist
in understanding our financial results.
Selected Benchmark Prices and Exchange Rates (1)
|
|
|
|
|
|
|
|
|
| |
|
Q1 2017 |
|
Q1 2016 |
|
Percent
Change |
|
Q4 2016 |
|
|
|
|
|
| Crude Oil Prices (US$/bbl, unless otherwise
indicated) |
|
|
|
|
|
|
|
|
| Brent |
|
|
|
|
|
|
|
|
| Average |
|
54.66 |
|
35.08 |
|
56% |
|
51.13 |
| End of Period |
|
52.83 |
|
39.60 |
|
33% |
|
56.82 |
| WTI |
|
|
|
|
|
|
|
|
| Average |
|
51.91 |
|
33.45 |
|
55% |
|
49.29 |
| End of Period |
|
50.60 |
|
38.34 |
|
32% |
|
53.72 |
| Average Differential Brent-WTI |
|
2.75 |
|
1.63 |
|
69% |
|
1.84 |
| WCS |
|
|
|
|
|
|
|
|
| Average |
|
37.33 |
|
19.21 |
|
94% |
|
34.97 |
| Average (C$/bbl) |
|
49.38 |
|
26.39 |
|
87% |
|
46.63 |
| End of Period |
|
39.77 |
|
26.75 |
|
49% |
|
38.81 |
| Average Differential WTI-WCS |
|
14.58 |
|
14.24 |
|
2% |
|
14.32 |
| Condensate (C5 @ Edmonton) |
|
|
|
|
|
|
|
|
| Average (2) |
|
52.26 |
|
34.39 |
|
52% |
|
48.33 |
| Average Differential WTI-Condensate (Premium)/Discount |
|
(0.35) |
|
(0.94) |
|
(63)% |
|
0.96 |
| Average Differential WCS-Condensate (Premium)/Discount |
|
(14.93) |
|
(15.18) |
|
(2)% |
|
(13.36) |
| Average Refined Product Prices (US$/bbl) |
|
|
|
|
|
|
|
|
| Chicago Regular Unleaded Gasoline (“RUL”) |
|
63.13 |
|
42.00 |
|
50% |
|
59.46 |
| Chicago Ultra-low Sulphur Diesel (“ULSD”) |
|
63.86 |
|
44.55 |
|
43% |
|
61.50 |
| Refining Margin: Average
3-2-1 Crack Spread (3) (US$/bbl) |
|
|
|
|
|
|
|
|
| Chicago |
|
11.54 |
|
9.58 |
|
20% |
|
10.96 |
| Average Natural Gas Prices |
|
|
|
|
|
|
|
|
| AECO (C$/Mcf) |
|
2.94 |
|
2.11 |
|
39% |
|
2.81 |
| NYMEX (US$/Mcf) |
|
3.32 |
|
2.09 |
|
59% |
|
2.98 |
| Basis Differential NYMEX-AECO (US$/Mcf) |
|
1.10 |
|
0.56 |
|
96% |
|
0.86 |
| Foreign Exchange Rate (US$ per C$1) |
|
|
|
|
|
|
|
|
| Average |
|
0.756 |
|
0.728 |
|
4% |
|
0.750 |
| (1) |
These benchmark prices do not reflect our realized sales prices. For our average realized sales prices and realized
risk management results, refer to the Netbacks table in the Operating Results section of this MD&A. |
| (2) |
The average Canadian dollar condensate benchmark price for the first quarter of 2017 was $69.13 per barrel (2016
– $47.24 per barrel). |
| (3) |
The average 3-2-1 Crack Spread is an
indicator of the refining margin and is valued on a last in, first out accounting basis. |
Crude Oil
Benchmarks
Average crude oil benchmark prices in the first quarter of 2017 increased significantly compared with 2016. Prices rose as
the Organization of Petroleum Exporting Countries (“OPEC”), along with select non-OPEC countries, such as Russia, reached an agreement in the fourth quarter of 2016 to reduce production. In the first
quarter of 2017, crude oil prices increased due to compliance with the plan to reduce production and expectations of future global crude oil inventory draws.
WTI is an important benchmark for Canadian crude oil since it reflects inland North American crude oil prices and its Canadian dollar equivalent is the
basis for determining royalties for a number of our crude oil properties. WTI benchmark prices weakened relative to Brent due to growing U.S. crude oil supply resulting in a build of U.S. crude oil inventory.
WCS is blended heavy oil which consists of both conventional heavy oil and unconventional diluted bitumen. The average
WTI-WCS differential widened slightly from the first quarter of 2016 due to increasing heavy oil production in Alberta and limited pipeline capacity.
Blending condensate with bitumen and heavy oil enables our production to be transported through pipelines. Our blending ratios range from approximately
10 percent to 33 percent. The WCS-Condensate differential is an important benchmark as a narrower differential generally results in an increase in the recovery of condensate costs when selling a
barrel of blended crude oil. When the supply of condensate in Alberta does not meet the demand, Edmonton condensate prices may be driven by U.S. Gulf Coast condensate prices plus the cost attributed to transporting the condensate to Edmonton.
|
|
|
| Cenovus Energy Inc. First Quarter 2017 Report |
|
Page 13 Management’s
Discussion and Analysis |
The average WTI-Condensate differential narrowed in the first
quarter of 2017 compared with 2016. Condensate prices rose relative to WTI as higher seasonal demand for condensate blending was further supported by increased demand resulting from the ramp-up of oil sands
production in Alberta.
Refining Benchmarks
The Chicago Regular Unleaded Gasoline (“RUL”) and Chicago Ultra-low Sulphur Diesel (“ULSD”)
benchmark prices are representative of inland refined product prices and are used to derive the Chicago 3-2-1 crack spread. The 3-2-1 crack spread is an indicator of the refining margin generated by converting three barrels of crude oil into two barrels of regular unleaded gasoline and one barrel of
ultra-low sulphur diesel using current month WTI-based crude oil feedstock prices valued on a last in, first out accounting basis.
Average Chicago refined product prices increased in the first quarter of 2017 compared with 2016 primarily due to higher crude oil prices and stronger
refined product demand. The increase in average Chicago 3-2-1 crack spreads in 2017 was due to increasing U.S. crude oil supply, resulting in a wider Brent-WTI differential, and strong refined product demand reducing refined product inventories. Our realized crack spreads are affected by many other factors such as the variety of crude oil feedstock, refinery
configuration and product output, the time lag between the purchase and delivery of crude oil feedstock, and the cost of feedstock which is valued on a first in, first out (“FIFO”) accounting basis.
Natural Gas Benchmarks
Average natural gas prices increased in the first quarter of 2017, despite mild average temperatures over the quarter, due to declining supply and lower
storage inventory levels relative to 2016.
Foreign Exchange Benchmark
Revenues are subject to foreign exchange exposure as the sales prices of our crude oil, natural gas and refined products are determined by reference to
U.S. benchmark prices. A decrease in the value of the Canadian dollar compared with the U.S. dollar has a positive impact on our reported results. Likewise, as the Canadian dollar strengthens, our reported results are lower. In addition to our
revenues being denominated in U.S. dollars, we have chosen to borrow U.S. dollar long-term debt. In periods of a strengthening Canadian dollar, our U.S. dollar debt gives rise to unrealized foreign exchange gains when translated to Canadian dollars.
In the first quarter of 2017, the Canadian dollar strengthened relative to the U.S. dollar due to higher crude oil benchmark prices, partially offset
by U.S. interest rate increases. The strengthening of the Canadian dollar, compared with the first quarter of 2016, had a negative impact of approximately $145 million on our revenues.
As at March 31, 2017, the Canadian dollar was stronger relative to the U.S. dollar than as at December 31, 2016, which resulted in
$56 million of unrealized foreign exchange gains on the translation of our U.S. dollar debt.
|
|
|
| Cenovus Energy Inc. First Quarter 2017 Report |
|
Page 14 Management’s
Discussion and Analysis |
FINANCIAL RESULTS
Selected Consolidated
Financial Results
Significant improvements in commodity prices in the first quarter of 2017 was the primary driver of our financial
results. The following key performance measures are discussed in more detail within this MD&A.
|
|
|
|
|
|
|
|
|
|
|
|
|
|
|
|
|
|
|
|
|
|
|
|
|
|
|
|
|
|
|
|
|
|
|
|
|
| |
|
2017 |
|
|
2016 |
|
|
2015 |
|
| ($ millions, except per share amounts) |
|
Q1 |
|
|
Q4 |
|
|
Q3 |
|
|
Q2 |
|
|
Q1 |
|
|
Q4 |
|
|
Q3 |
|
|
Q2 |
|
|
Q1 |
|
| Revenues |
|
|
3,865 |
|
|
|
3,642 |
|
|
|
3,240 |
|
|
|
3,007 |
|
|
|
2,245 |
|
|
|
2,924 |
|
|
|
3,273 |
|
|
|
3,726 |
|
|
|
3,141 |
|
| Operating Margin (1) |
|
|
450 |
|
|
|
595 |
|
|
|
487 |
|
|
|
541 |
|
|
|
144 |
|
|
|
357 |
|
|
|
602 |
|
|
|
932 |
|
|
|
548 |
|
| Cash From Operating Activities |
|
|
328 |
|
|
|
164 |
|
|
|
310 |
|
|
|
205 |
|
|
|
182 |
|
|
|
322 |
|
|
|
542 |
|
|
|
335 |
|
|
|
275 |
|
| Adjusted Funds Flow (2) |
|
|
323 |
|
|
|
535 |
|
|
|
422 |
|
|
|
440 |
|
|
|
26 |
|
|
|
275 |
|
|
|
444 |
|
|
|
477 |
|
|
|
495 |
|
| Operating Earnings (Loss) (2) |
|
|
(39) |
|
|
|
321 |
|
|
|
(236 |
) |
|
|
(39 |
) |
|
|
(423 |
) |
|
|
(438 |
) |
|
|
(28 |
) |
|
|
151 |
|
|
|
(88) |
|
| Per Share – Diluted ($) |
|
|
(0.05) |
|
|
|
0.39 |
|
|
|
(0.28 |
) |
|
|
(0.05 |
) |
|
|
(0.51 |
) |
|
|
(0.53 |
) |
|
|
(0.03 |
) |
|
|
0.18 |
|
|
|
(0.11) |
|
| Net Earnings (Loss) |
|
|
211 |
|
|
|
91 |
|
|
|
(251 |
) |
|
|
(267 |
) |
|
|
(118 |
) |
|
|
(641 |
) |
|
|
1,801 |
|
|
|
126 |
|
|
|
(668) |
|
| Per Share – Basic and Diluted ($) |
|
|
0.25 |
|
|
|
0.11 |
|
|
|
(0.30 |
) |
|
|
(0.32 |
) |
|
|
(0.14 |
) |
|
|
(0.77 |
) |
|
|
2.16 |
|
|
|
0.15 |
|
|
|
(0.86) |
|
| Capital Investment (3) |
|
|
313 |
|
|
|
259 |
|
|
|
208 |
|
|
|
236 |
|
|
|
323 |
|
|
|
428 |
|
|
|
400 |
|
|
|
357 |
|
|
|
529 |
|
| Dividends |
|
|
|
|
|
|
|
|
|
|
|
|
|
|
|
|
|
|
|
|
|
|
|
|
|
|
|
|
|
|
|
|
|
|
|
|
| Cash Dividends |
|
|
41 |
|
|
|
42 |
|
|
|
41 |
|
|
|
42 |
|
|
|
41 |
|
|
|
132 |
|
|
|
133 |
|
|
|
125 |
|
|
|
138 |
|
| In Shares From Treasury |
|
|
- |
|
|
|
- |
|
|
|
- |
|
|
|
- |
|
|
|
- |
|
|
|
- |
|
|
|
- |
|
|
|
98 |
|
|
|
84 |
|
| Per Share ($) |
|
|
0.05 |
|
|
|
0.05 |
|
|
|
0.05 |
|
|
|
0.05 |
|
|
|
0.05 |
|
|
|
0.16 |
|
|
|
0.16 |
|
|
|
0.2662 |
|
|
|
0.2662 |
|
| (1) |
Additional subtotal found in Note 1 of the interim Consolidated Financial Statements and defined in this MD&A.
|
| (2) |
Non-GAAP measure defined in this MD&A. |
| (3) |
Includes expenditures on PP&E, E&E assets, and Assets Held for sale. |
Revenues
|
|
|
| ($ millions) |
|
|
| Revenues for the Three Months Ended
March 31, 2016 |
|
2,245 |
| Increase (Decrease) due to: |
|
|
| Oil Sands |
|
565 |
| Conventional |
|
70 |
| Refining and Marketing |
|
1,016 |
| Corporate and Eliminations |
|
(31) |
| Revenues for the Three Months Ended March 31, 2017 |
|
3,865 |
Combined Oil Sands and Conventional revenues almost doubled in the first quarter of 2017 due to higher commodity prices
and a rise in sales volumes, partially offset by higher royalties and the strengthening of the Canadian dollar relative to the U.S. dollar.
Revenues
from our Refining and Marketing segment increased 64 percent from 2016. Refining revenues rose due to the increase in refined product pricing, consistent with higher Chicago RUL and Chicago ULSD benchmark prices. The rise was partially offset
by decreased refined product output associated with the planned turnarounds at both Refineries in 2017 and the strengthening of the Canadian dollar relative to the U.S. dollar. Revenues from third-party crude
oil and natural gas sales undertaken by the marketing group more than doubled from the first quarter of 2016, primarily due to higher sales prices and an increase in purchased crude oil and condensate sales volumes, partially offset by a decline in
purchased natural gas sales volumes.
Corporate and Eliminations revenues relate to sales and operating revenues between segments and are recorded at
transfer prices based on current market prices.
Further information regarding our revenues can be found in the Reportable Segments section of this
MD&A.
|
|
|
| Cenovus Energy Inc. First Quarter 2017 Report |
|
Page 15 Management’s
Discussion and Analysis |
Operating Margin
Operating Margin is an additional subtotal found in Note 1 of the interim Consolidated Financial Statements and is used to provide a consistent measure of
the cash generating performance of our assets for comparability of our underlying financial performance between periods. Operating Margin is defined as revenues less purchased product, transportation and blending, operating expenses, production and
mineral taxes plus realized gains less realized losses on risk management activities. Items within the Corporate and Eliminations segment are excluded from the calculation of Operating Margin.
|
|
|
|
|
|
|
| |
|
Three Months Ended March 31, |
| ($ millions) |
|
2017 |
|
|
|
2016 |
| Revenues |
|
3,963 |
|
|
|
2,312 |
| (Add) Deduct: |
|
|
|
|
|
|
| Purchased Product |
|
2,330 |
|
|
|
1,428 |
| Transportation and Blending |
|
617 |
|
|
|
451 |
| Operating Expenses |
|
469 |
|
|
|
452 |
| Production and Mineral Taxes |
|
5 |
|
|
|
2 |
| Realized (Gain) Loss on Risk Management Activities |
|
92 |
|
|
|
(165) |
| Operating Margin |
|
450 |
|
|
|
144 |
Operating Margin increased $306 million in the first quarter of 2017 primarily due to:
| ● |
|
Our average crude oil sales price almost tripling and our average natural gas sales price increasing 29 percent,
consistent with higher associated benchmark prices; |
| ● |
|
Higher Operating Margin from Refining and Marketing due to a rise in average market crack spreads, partially offset by a
realized risk management loss compared with a gain in 2016, a decline in crude utilization rates, a decrease in margins on the sale of secondary products, and an increase in operating costs; and |
| ● |
|
An 11 percent increase in our crude oil sales volumes. |
These increases in Operating Margin were partially offset by:
| ● |
|
Realized risk management losses of $90 million, excluding Refining and Marketing, compared with gains of
$145 million in the first quarter of 2016; |
| ● |
|
A rise in transportation and blending expenses due to higher blending costs, related to an increase in condensate prices
and condensate volumes required for blending our increased oil sands production; and |
| ● |
|
Higher royalties primarily due to an increase in the WTI benchmark price (which determines the royalty rate) and a rise
in our crude oil sales price. |
Operating Margin Variance
Additional details explaining the changes in Operating Margin can be found in the Reportable Segments section of this
MD&A.
|
|
|
| Cenovus Energy Inc. First Quarter 2017 Report |
|
Page 16 Management’s
Discussion and Analysis |
Cash From Operating Activities and Adjusted Funds Flow
Adjusted Funds Flow is a non-GAAP measure commonly used in the oil and gas industry to assist in measuring a
company’s ability to finance its capital programs and meet its financial obligations. Adjusted Funds Flow is defined as Cash From Operating Activities excluding net change in other assets and liabilities and net change in non-cash working capital. Net change in other assets and liabilities is composed of site restoration costs and pension funding. Non-cash working capital is composed of current
assets and current liabilities, excluding cash and cash equivalents and risk management.
|
|
|
|
|
|
|
| |
|
Three Months Ended March 31, |
| ($ millions) |
|
2017 |
|
|
|
2016 |
| Cash From Operating
Activities |
|
328 |
|
|
|
182 |
| (Add) Deduct: |
|
|
|
|
|
|
| Net Change in Other Assets and Liabilities |
|
(31) |
|
|
|
(29) |
| Net Change in Non-Cash Working Capital |
|
36 |
|
|
|
185 |
| Adjusted Funds Flow |
|
323 |
|
|
|
26 |
In the first quarter of 2017, Cash From Operating Activities and Adjusted Funds Flow increased significantly primarily as
a result of higher Operating Margin, as discussed above. The change in non-cash working capital for the three months ended March 31, 2017 was primarily due to a decline in accounts receivable, partially
offset by a decrease in accounts payable. Accounts receivable declined as a result of lower crude oil sales volumes in March 2017 as compared to December 2016. Accounts payable declined primarily due to the repayment of a note payable to partner in
the first quarter of 2017. In addition, upstream inventory increased primarily due to fulfilling our linefill requirements on the Athabasca Pipeline Twinning Project.
Operating Earnings (Loss)
Operating Earnings (Loss) is a non-GAAP measure used to provide a consistent measure of the comparability of our
underlying financial performance between periods by removing non-operating items. Operating Earnings (Loss) is defined as Earnings (Loss) Before Income Tax excluding gain (loss) on discontinuance, gain on
bargain purchase, unrealized risk management gains (losses) on derivative instruments, unrealized foreign exchange gains (losses) on translation of U.S. dollar denominated notes issued from Canada, foreign exchange gains (losses) on settlement of
intercompany transactions, gains (losses) on divestiture of assets, less income taxes on Operating Earnings (Loss) before tax, excluding the effect of changes in statutory income tax rates and the recognition of an increase in U.S. tax basis.
|
|
|
|
|
|
|
| |
|
Three Months Ended March 31, |
| ($ millions) |
|
2017 |
|
|
|
2016 |
| Earnings (Loss), Before Income
Tax |
|
260 |
|
|
|
(335) |
| Add (Deduct): |
|
|
|
|
|
|
| Unrealized Risk Management (Gain) Loss (1) |
|
(279) |
|
|
|
149 |
| Non-operating Unrealized Foreign Exchange (Gain) Loss (2) |
|
(56) |
|
|
|
(413) |
| (Gain) Loss on Divestiture of Assets |
|
1 |
|
|
|
- |
| Operating Earnings (Loss), Before Income Tax |
|
(74) |
|
|
|
(599) |
| Income Tax Expense (Recovery) |
|
(35) |
|
|
|
(176) |
| Operating Earnings (Loss) |
|
(39) |
|
|
|
(423) |
| (1) |
Includes the reversal of unrealized (gains) losses recorded in prior periods. |
| (2) |
Includes unrealized foreign exchange (gains) losses on translation of U.S. dollar denominated notes issued from Canada
and foreign exchange (gains) losses on settlement of intercompany transactions. |
Operating Loss decreased compared with the
first quarter of 2016 primarily due to an increase in Cash from Operating Activities and Adjusted Funds Flow, as discussed above, and a decline in depreciation, depletion and amortization (“DD&A”) primarily related to an impairment
loss of $170 million associated with our Northern Alberta CGU recorded in 2016. In 2017, exploration expense was $3 million (2016 – $1 million).
Net Earnings
|
|
|
| ($ millions) |
|
|
| Net Earnings (Loss) for the Three
Months Ended March 31, 2016 |
|
(118) |
| Increase (Decrease) due to: |
|
|
| Operating Margin |
|
306 |
| Corporate and Eliminations: |
|
|
| Unrealized Risk Management Gain (Loss) |
|
428 |
| Unrealized Foreign Exchange Gain (Loss) |
|
(337) |
| Gain (Loss) on Divestiture of Assets |
|
(1) |
| Expenses (1) |
|
22 |
| DD&A |
|
179 |
| Exploration Expense |
|
(2) |
| Income Tax Recovery (Expense) |
|
(266) |
| Net Earnings (Loss) for the Three Months Ended March 31, 2017 |
|
211 |
| (1) |
Includes general and administrative, finance costs, interest income, realized foreign exchange (gains) losses,
transaction costs, research costs, other (income) loss, net and Corporate and Eliminations revenues, purchased product, transportation and blending, and operating expenses. |
|
|
|
| Cenovus Energy Inc. First Quarter 2017 Report |
|
Page 17 Management’s
Discussion and Analysis |
In the first quarter of 2017, Net Earnings increased primarily due to:
| ● |
|
Unrealized risk management gains of $279 million (2016 – unrealized losses of $149 million); and
|
| ● |
|
Lower Operating Losses, as discussed above. |
The increase was partially offset by non-operating unrealized foreign exchange gains of $56 million as
compared with gains of $413 million in 2016 and a deferred income tax expense of $71 million (2016 – recovery of $190 million).
Net Capital Investment
|
|
|
|
|
|
|
| Three Months Ended March 31, |
| ($ millions) |
|
2017 |
|
|
|
2016 |
| Oil Sands |
|
172 |
|
|
|
227 |
| Conventional |
|
88 |
|
|
|
39 |
| Refining and Marketing |
|
46 |
|
|
|
52 |
| Corporate and Eliminations |
|
7 |
|
|
|
5 |
| Capital Investment |
|
313 |
|
|
|
323 |
| Acquisitions and Divestitures |
|
- |
|
|
|
- |
| Net Capital Investment (1) |
|
313 |
|
|
|
323 |
| (1) |
Includes expenditures on PP&E, E&E assets, and assets held for sale. |
Capital investment in the first quarter of 2017 declined three percent compared with 2016. In the first quarter of 2016, work continued on the two
expansion phases, Foster Creek phase G and Christina Lake phase F. In 2017, Oil Sands capital investment focused primarily on sustaining capital related to existing production; stratigraphic test wells to determine pad placement for sustaining
wells, near-term expansion phases, and progression of certain emerging assets; and module assembly for Christina Lake expansion phase G. Conventional capital investment focused on sustaining capital and the
ramp-up of the tight oil drilling program in Southern Alberta. Capital investment in the Refining and Marketing segment focused on capital maintenance and reliability work.
Further information regarding our capital investment can be found in the Reportable Segments section of this MD&A.
Capital Investment Decisions
Our disciplined approach to capital allocation includes prioritizing our uses of cash in the following manner:
| ● |
|
First, to capital for our existing business operations; |
| ● |
|
Second, to paying a dividend as part of providing strong total shareholder return; and |
| ● |
|
Third, for growth or discretionary capital. |
Our approach to capital allocation includes evaluating all opportunities using specific rigorous criteria within the context of achieving our objectives
of maintaining a prudent and flexible capital structure and strong balance sheet metrics, which position us to be financially resilient in times of lower cash flows. In addition, we continue to evaluate other corporate and financial opportunities,
including generating cash from our existing portfolio. Refer to the Liquidity and Capital Resources section of this MD&A for further information.
|
|
|
|
|
|
|
| Three Months Ended March 31, |
| ($ millions) |
|
2017 |
|
|
|
2016 |
| Adjusted Funds Flow |
|
323 |
|
|
|
26 |
| Capital Investment (Sustaining and Growth) |
|
313 |
|
|
|
323 |
| Free Funds Flow (1) |
|
10 |
|
|
|
(297) |
| Cash Dividends |
|
41 |
|
|
|
41 |
|
|
(31) |
|
|
|
(338) |
| (1) |
Free Funds Flow is a non-GAAP measure defined as Adjusted Funds Flow less
capital investment. |
On March 29, 2017, we entered into a purchase and sale agreement (the “Acquisition
Agreement”) with ConocoPhillips to acquire ConocoPhillips’ 50 percent interest in FCCL and the majority of ConocoPhillips’ Deep Basin Assets. The Acquisition, which is subject to customary closing conditions and regulatory
approvals, is expected to close in the second quarter of 2017. See the Transformational Acquisition section of this MD&A for more details. We intend to update our 2017 guidance estimates, including future capital investment, after the
transaction closes. In the first quarter of 2016, capital investment in excess of Adjusted Funds Flow was funded through our cash balance on hand.
|
|
|
| Cenovus Energy Inc. First Quarter 2017 Report |
|
Page 18 Management’s
Discussion and Analysis |
REPORTABLE SEGMENTS
|
|
|
|
|
| Our reportable segments are as follows:
Oil Sands, which includes the development and production of bitumen and natural gas in northeast Alberta. Cenovus’s bitumen assets include
Foster Creek, Christina Lake and Narrows Lake as well as projects in the early stages of development, such as Telephone Lake. Certain of Cenovus’s operated oil sands properties, notably Foster Creek, Christina Lake and Narrows Lake, are jointly
owned with ConocoPhillips, an unrelated U.S. public company.
Conventional, which includes the development and production of conventional crude oil, NGLs and natural gas in Alberta and Saskatchewan, including
the heavy oil assets at Pelican Lake, the carbon dioxide enhanced oil recovery project at Weyburn and emerging tight oil opportunities.
Refining and Marketing, which is responsible for transporting, selling and refining crude oil into petroleum and chemical products. Cenovus jointly
owns two refineries in the U.S. with the operator Phillips 66, an unrelated U.S. public company. In addition, Cenovus owns and operates a crude-by-rail terminal in
Alberta. This segment coordinates Cenovus’s marketing and transportation initiatives to optimize product mix, delivery points, transportation commitments and customer diversification. |
|
|
|
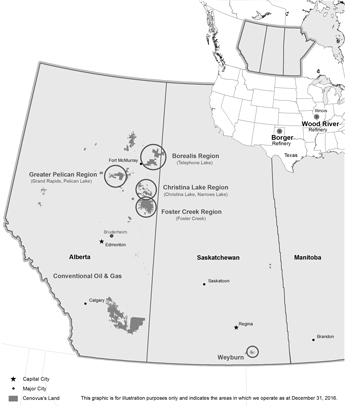
|
Corporate and Eliminations, which primarily includes unrealized gains and losses recorded on derivative financial
instruments, gains and losses on divestiture of assets, as well as other Cenovus-wide costs for general and administrative, financing activities and research costs. As financial instruments are settled, the realized gains and losses are recorded in
the reportable segment to which the derivative instrument relates. Eliminations relate to sales and operating revenues, and purchased product between segments, recorded at transfer prices based on current market prices, and to unrealized
intersegment profits in inventory.
Revenues by Reportable Segment
|
|
|
|
|
|
|
| Three Months Ended March 31, |
| ($ millions) |
|
2017 |
|
|
|
2016 |
| Oil Sands |
|
1,035 |
|
|
|
470 |
| Conventional |
|
324 |
|
|
|
254 |
| Refining and Marketing |
|
2,604 |
|
|
|
1,588 |
| Corporate and Eliminations |
|
(98) |
|
|
|
(67) |
|
|
3,865 |
|
|
|
2,245 |
OIL SANDS
In northeastern
Alberta, we are a 50 percent partner in the Foster Creek, Christina Lake and Narrows Lake oil sands projects. We have several emerging projects in the early stages of development, including our
100 percent-owned project at Telephone Lake. The Oil Sands segment also includes the Athabasca natural gas property, from which a portion of the natural gas production is used as fuel at the adjacent
Foster Creek operations.
Significant developments that impacted our Oil Sands segment in the first quarter of 2017 compared with 2016 include:
| ● |
|
Increasing crude oil production by 32 percent due to incremental production volumes from ramp up of Foster Creek
phase G and Christina Lake phase F, both of which started-up in the second half of 2016; |
| ● |
|
Achieving crude oil Netbacks, excluding realized risk management activities, of $21.52 per barrel compared with a loss of
$6.10 per barrel in 2016; |
| ● |
|
Reducing our crude oil operating costs by $0.55 per barrel, a six percent decline; and |
| ● |
|
Generating Operating Margin net of capital investment of $80 million, an increase of $262 million.
|
|
|
|
| Cenovus Energy Inc. First Quarter 2017 Report |
|
Page 19 Management’s
Discussion and Analysis |
Oil Sands – Crude Oil
Financial Results
|
|
|
|
|
|
|
|
|
| Three Months Ended March 31, |
| ($ millions) |
|
2017 |
|
|
|
|
2016 |
| Gross Sales |
|
1,055 |
|
|
|
|
|
465 |
| Less: Royalties |
|
27 |
|
|
|
|
|
- |
| Revenues |
|
1,028 |
|
|
|
|
|
465 |
| Expenses |
|
|
|
|
|
|
|
|
| Transportation and Blending |
|
566 |
|
|
|
|
|
404 |
| Operating |
|
136 |
|
|
|
|
|
122 |
| (Gain) Loss on Risk Management |
|
77 |
|
|
|
|
|
(106) |
| Operating Margin |
|
249 |
|
|
|
|
|
45 |
| Capital Investment |
|
169 |
|
|
|
|
|
227 |
| Operating Margin Net of Related Capital Investment |
|
80 |
|
|
|
|
|
(182) |
In 2016, capital investment in excess of Operating Margin from Oil Sands was funded through Operating Margin generated by
our Conventional segment as well as our cash balance on hand.
Operating Margin Variance
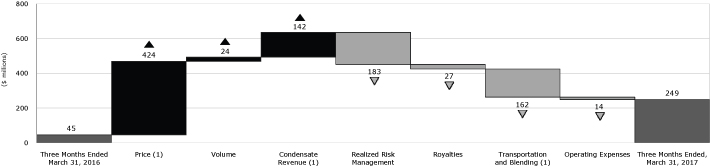
| (1) |
Revenues include the value of condensate sold as heavy oil blend. Condensate costs are recorded in transportation and
blending expense. The crude oil price variance excludes the impact of condensate purchases. |
Revenues
Price
In the first quarter of 2017, our average crude oil sales price increased substantially to $38.08 per barrel (2016 – $10.13 per barrel). The
significant rise in our crude oil price was consistent with the increase in the WCS and Christina Dilbit Blend (“CDB”) benchmark prices and the narrowing of the WCS-Condensate differential, partially
offset by the strengthening of the Canadian dollar relative to the U.S. dollar. Our crude oil sales price is influenced by the cost of condensate used in blending. Our blending ratios range between 25 percent and 33 percent. As the cost of
condensate decreases relative to the price of blended crude oil, our bitumen sales price increases. Due to high demand for condensate at Edmonton, we also purchase condensate from U.S. markets. As such, our average cost of condensate is generally
higher than the Edmonton benchmark price due to transportation between market hubs and transportation to field locations. In addition, up to three months may elapse from when we purchase condensate to when we blend it with our production. In a
rising price environment, we expect to see some benefit in our bitumen sales price as we are using condensate purchased at a lower price earlier in the year.
The WCS-CDB differential narrowed by nine percent compared with the first quarter of 2016 to a discount of US$1.79
per barrel. In the first quarter of 2017, 85 percent of our Christina Lake production was sold as CDB (2016 – 90 percent), with the remainder sold into the WCS stream. Christina Lake production, whether sold as CDB or blended with WCS
and subject to a quality equalization charge, is priced at a discount to WCS. Sales volumes at Christina Lake were significantly lower than production volumes during the three months ended March 31, 2017 primarily due to fulfilling our linefill
requirements on the Athabasca Pipeline Twinning Project.
|
|
|
| Cenovus Energy Inc. First Quarter 2017 Report |
|
Page 20 Management’s
Discussion and Analysis |
Production Volumes
|
|
|
|
|
|
|
|
|
|
|
|
|
|
|
| |
|
Three Months Ended March 31, |
| (barrels per day) |
|
2017 |
|
|
|
|
Percent
Change |
|
|
|
|
2016 |
| Foster Creek |
|
80,866 |
|
|
|
|
|
33% |
|
|
|
|
|
60,882 |
| Christina Lake |
|
100,635 |
|
|
|
|
|
31% |
|
|
|
|
|
77,093 |
|
|
181,501 |
|
|
|
|
|
32% |
|
|
|
|
|
137,975 |
In the first quarter of 2017, production rose at Foster Creek primarily due to incremental production volumes from the
phase G expansion and additional wells that were brought online. Production from Christina Lake increased compared with 2016 due to incremental production volumes from the phase F expansion and reliable performance of our facilities. Ramp-up of phase G at Foster Creek and phase F at Christina Lake is progressing well and is expected to be completed in the second half of 2017.
Condensate
The
bitumen currently produced by Cenovus must be blended with condensate to reduce its thickness in order to transport it to market through pipelines. Revenues represent the total value of blended crude oil sold and includes the value of condensate.
Consistent with the narrowing of the WCS-Condensate differential in the first quarter of 2017, the proportion of the cost of condensate recovered increased.
Royalties
Royalty
calculations for our oil sands projects are based on government prescribed pre- and post-payout royalty rates which are determined on a sliding scale using the Canadian dollar equivalent WTI benchmark price.
Royalty calculations differ between properties.
Royalties at Foster Creek, a post-payout project, are based on an annualized calculation which uses
the greater of: (1) the gross revenues multiplied by the applicable royalty rate (one to nine percent, based on the Canadian dollar equivalent WTI benchmark price); or (2) the net profits of the project multiplied by the applicable royalty
rate (25 to 40 percent, based on the Canadian dollar equivalent WTI benchmark price). Gross revenues are a function of sales volumes and realized sales prices. Net profits are a function of sales volumes, realized sales prices and allowed
operating and capital costs. In the first quarter of 2017, our royalty calculation was based on net profits as compared with a calculation based on gross revenues in 2016.
Royalties at Christina Lake, a pre-payout project, are based on a monthly calculation that applies a royalty rate
(ranging from one to nine percent, based on the Canadian dollar equivalent WTI benchmark price) to the gross revenues from the project.
Effective Royalty Rates
|
|
|
|
|
| |
|
Three Months Ended March 31, |
| (percent) |
|
2017 |
|
2016 |
| Foster Creek |
|
8.5 |
|
(4.9) |
| Christina Lake |
|
2.7 |
|
1.2 |
Royalties increased $27 million compared with the first quarter of 2016. At Foster Creek, higher royalties were due
to a rise in crude oil sales prices and an increase in the WTI benchmark price (which determines the royalty rate). In the first quarter of 2016, the negative royalty rate was primarily due to low crude oil sales prices and a true-up of the 2015 royalty calculation. The Christina Lake royalty rate increased in 2017 as a result of the rise in the WTI benchmark price (which determines the royalty rate) and higher sales prices.
Expenses
Transportation and Blending
Transportation and blending costs increased $162 million. Blending costs increased
due to higher condensate prices and a rise in condensate volumes required for our increased production. Our condensate costs were higher than the average Edmonton benchmark price in the first quarter, primarily due to the transportation expense
associated with moving the condensate to our oil sands projects, partially offset by the utilization of lower priced inventory.
Transportation costs
increased slightly primarily due to higher sales volumes, partially offset by a decline in sales to the U.S. market resulting in lower costs associated with pipeline tariffs. To help ensure adequate capacity for our expected production growth, we
have capacity commitments in excess of our current production. Production growth is expected to reduce our per-barrel transportation costs.
In addition, rail costs rose as higher volumes were moved by rail in the first quarter of 2017 as a result of increased pipeline congestion. We
transported an average of 5,236 barrels per day of crude oil by rail (2016 – 2,314 barrels per day).
|
|
|
| Cenovus Energy Inc. First Quarter 2017 Report |
|
Page 21 Management’s
Discussion and Analysis |
Operating
Primary drivers of our operating expenses for the first quarter were workforce, fuel, workovers, and chemical costs. Total operating expenses increased
$14 million primarily as a result of higher natural gas prices that increased fuel costs, partially offset by a decline in repairs and maintenance activities.
Per-unit Operating Expenses
|
|
|
|
|
|
|
|
|
|
|
| |
|
Three Months Ended March 31, |
| ($/bbl) |
|
2017 |
|
|
|
Percent
Change |
|
|
|
2016 |
| Foster Creek |
|
|
|
|
|
|
|
|
|
|
| Fuel |
|
2.93 |
|
|
|
18% |
|
|
|
2.48 |
| Non-fuel |
|
7.06 |
|
|
|
(26)% |
|
|
|
9.57 |
| Total |
|
9.99 |
|
|
|
(17)% |
|
|
|
12.05 |
| Christina Lake |
|
|
|
|
|
|
|
|
|
|
| Fuel |
|
2.57 |
|
|
|
31% |
|
|
|
1.96 |
| Non-fuel |
|
5.51 |
|
|
|
(2)% |
|
|
|
5.65 |
| Total |
|
8.08 |
|
|
|
6% |
|
|
|
7.61 |
| Total |
|
8.97 |
|
|
|
(6)% |
|
|
|
9.52 |
In the first quarter of 2017, Foster Creek fuel costs rose compared with 2016 due to higher natural gas prices partially
offset by a decline in fuel consumption on a per-barrel basis. Non-fuel operating expenses declined on a per-barrel basis
primarily due to higher production, in addition to:
| ● |
|
A true-up of the 2016 emissions charge under the Specified Gas Emitters
Regulation (“SGER”) program; and |
| ● |
|
Lower repairs and maintenance costs from focusing on critical operational activities. |
The decline was partially offset by an increase in workover activities related to more pump changes and higher well servicing costs.
At Christina Lake, fuel costs increased in 2017 due to higher natural gas prices partially offset by a decrease in fuel consumption on a per-barrel basis. Non-fuel operating expenses decreased on a per-barrel basis primarily due to higher production, in addition to:
| ● |
|
Lower well workover costs related to a decrease in well servicing fees; |
| ● |
|
A decrease in electricity costs related to the electrical generation capacity added in the fourth quarter of 2016; and
|
| ● |
|
Lower repairs and maintenance costs from focusing on critical operational activities. |
The decline was partially offset by a true-up of the 2016 emissions charged under the SGER program. Christina
Lake’s emissions are below the threshold set by the SGER program and generate performance credits which are applied to the charges incurred at Foster Creek.
Netbacks (1)
|
|
|
|
|
|
|
|
|
|
|
|
|
|
|
| |
|
Foster Creek |
|
|
|
Christina Lake |
| |
|
Three Months Ended March 31, |
| ($/bbl) |
|
2017 |
|
|
|
2016 |
|
|
|
2017 |
|
|
|
2016 |
| Sales Price |
|
40.62 |
|
|
|
11.82 |
|
|
|
35.86 |
|
|
|
8.85 |
| Royalties |
|
2.83 |
|
|
|
(0.16) |
|
|
|
0.86 |
|
|
|
0.05 |
| Transportation and Blending |
|
7.72 |
|
|
|
8.70 |
|
|
|
4.13 |
|
|
|
5.28 |
| Operating Expenses |
|
9.99 |
|
|
|
12.05 |
|
|
|
8.08 |
|
|
|
7.61 |
| Netback Excluding Realized Risk Management |
|
20.08 |
|
|
|
(8.77) |
|
|
|
22.79 |
|
|
|
(4.09) |
| Realized Risk Management Gain (Loss) |
|
(5.73) |
|
|
|
9.49 |
|
|
|
(4.52) |
|
|
|
7.43 |
| Netback Including Realized Risk Management |
|
14.35 |
|
|
|
0.72 |
|
|
|
18.27 |
|
|
|
3.34 |
| (1) |
Netbacks reflect our margin on a per-barrel basis of unblended crude oil. |
Risk Management
Risk management activities in the first quarter of 2017 resulted in realized losses of $77 million (2016 – realized gains of $106 million),
consistent with average benchmark prices exceeding our contract prices.
Oil Sands – Natural Gas
Oil Sands includes our natural gas operations in northeastern Alberta. A portion of the natural gas produced from our Athabasca property is used as fuel
at Foster Creek. Our natural gas production for the first quarter of 2017, net of internal usage, was 15 MMcf per day (2016 – 17 MMcf per day). Operating Margin was $1 million in 2017, consistent with the first quarter of 2016 as higher
natural gas prices were offset by lower production.
|
|
|
| Cenovus Energy Inc. First Quarter 2017 Report |
|
Page 22 Management’s
Discussion and Analysis |
Oil Sands – Capital Investment
|
|
|
|
|
|
|
| Three Months Ended March 31, |
| ($ millions) |
|
2017 |
|
|
|
2016 |
| Foster Creek |
|
70 |
|
|
|
89 |
| Christina Lake |
|
63 |
|
|
|
114 |
|
|
133 |
|
|
|
203 |
| Narrows Lake |
|
5 |
|
|
|
4 |
| Telephone Lake |
|
24 |
|
|
|
7 |
| Grand Rapids |
|
- |
|
|
|
5 |
| Other (1) |
|
10 |
|
|
|
8 |
| Capital Investment (2) |
|
172 |
|
|
|
227 |
| (1) |
Includes new resource plays and Athabasca natural gas. |
| (2) |
Includes expenditures on PP&E, E&E assets, and assets held for sale. |
Existing Projects
Capital investment at Foster Creek in the first quarter of 2017 focused on sustaining capital related to existing production and stratigraphic test wells.
Capital investment declined in the current quarter compared with 2016. In the first quarter of 2016, capital spending was focused on the completion of expansion phase G and stratigraphic test wells.
In 2017, Christina Lake capital investment focused on sustaining capital related to existing production, stratigraphic test wells, and module assembly
related to the phase G expansion. Capital investment decreased in the first quarter of 2017 compared with 2016. In the first quarter of 2016, capital was focused on the completion of expansion phase F and stratigraphic test wells.
Capital investment at Narrows Lake in 2017 focused on drilling of stratigraphic test wells to further progress the project. Capital investment remained
relatively consistent in the first quarter of 2017 compared with 2016.
Emerging Projects
In 2017, Telephone Lake capital investment focused on the drilling of stratigraphic test wells to further assess the project. In the first quarter of
2017, Telephone Lake capital investment increased compared with 2016. In 2016, spending was reduced in response to the low commodity price environment and focused on front-end engineering work for the central
processing facility.
Drilling Activity
|
|
|
|
|
|
|
|
|
|
|
|
|
|
|
|
|
|
|
| |
|
Gross Stratigraphic
Test Wells |
|
|
|
|
Gross Production
Wells (1) |
| Three Months Ended March 31, |
|
2017 |
|
|
|
|
2016 |
|
|
|
|
2017 |
|
|
|
2016 |
| Foster Creek |
|
92 |
|
|
|
|
|
95 |
|
|
|
|
|
- |
|
|
|
4 |
| Christina Lake |
|
98 |
|
|
|
|
|
97 |
|
|
|
|
|
- |
|
|
|
18 |
|
|
190 |
|
|
|
|
|
192 |
|
|
|
|
|
- |
|
|
|
22 |
| Narrows Lake |
|
2 |
|
|
|
|
|
- |
|
|
|
|
|
- |
|
|
|
- |
| Telephone Lake |
|
13 |
|
|
|
|
|
- |
|
|
|
|
|
- |
|
|
|
- |
| Other |
|
1 |
|
|
|
|
|
5 |
|
|
|
|
|
- |
|
|
|
- |
|
|
206 |
|
|
|
|
|
197 |
|
|
|
|
|
- |
|
|
|
22 |
| (1) |
SAGD well pairs are counted as a single producing well. |
Stratigraphic test wells were drilled to
help identify well pad locations for sustaining wells and near-term expansion phases and to further progress the evaluation of emerging assets.
Future Capital Investment
On March 29, 2017, we entered into a purchase and sale agreement with ConocoPhillips to
acquire ConocoPhillips’ 50 percent interest in FCCL, which will increase our interest in FCCL to 100 percent. The Acquisition, which is subject to customary closing conditions and regulatory approvals, will have an effective date of
January 1, 2017 and is expected to close in the second quarter of 2017. See the Transformational Acquisition section of this MD&A for more details. We intend to update our 2017 guidance estimates, including future capital investment, after
the transaction closes. The following future capital investment information does not reflect closing of the Acquisition.
Our 2017 Oil Sands capital
investment is forecast to be between $685 million and $815 million. For more information, we direct our readers to review the news release for our 2017 guidance dated December 8, 2016. The news release is available on SEDAR at
sedar.com, on EDGAR at sec.gov, and on our website at cenovus.com.
Foster Creek is currently producing from phases A through G. Capital investment
for 2017 is forecast to be between $325 million and $375 million. We plan to continue focusing on sustaining capital related to existing production and to progress engineering and design work on phase H. Spending related to construction
work on phase H was deferred in 2015 in response to the low commodity price environment. At our Investor Day in June 2017, we plan to provide an update on our plans for Foster Creek phase H.
|
|
|
| Cenovus Energy Inc. First Quarter 2017 Report |
|
Page 23 Management’s
Discussion and Analysis |
Christina Lake is producing from phases A through F. Capital investment for 2017 is forecast to be between
$300 million and $350 million, focused on sustaining capital and resuming construction of the phase G expansion, which had previously been deferred. Field construction of phase G, which has an initial design capacity of 50,000 gross
barrels per day, has commenced and will continue ramp up in the first half of 2017. We received regulatory approval in December 2015 for the phase H expansion, a 50,000 gross barrels per day phase.
Capital investment at Narrows Lake and our new resource plays in 2017 is forecast to be between $60 million and $90 million, focusing on a
stratigraphic test well program at Telephone Lake and Narrows Lake, and engineering and equipment preservation related to the suspension of construction at Narrows Lake. At our Investor Day in June 2017, we plan to provide an update on our plans for
Narrows Lake phase A.
DD&A and Exploration Expense
We deplete crude oil and natural gas properties on a unit-of-production
basis over proved reserves. The unit-of-production rate takes into account expenditures incurred to date, together with future development expenditures required to
develop those proved reserves. This rate, calculated at an area level, is then applied to our sales volume to determine DD&A in a given period. We believe that this method of calculating DD&A charges each barrel of crude oil equivalent sold
with its proportionate share of the cost of capital invested over the total estimated life of the related asset as represented by proved reserves.
The following calculation illustrates how the implied depletion rate for our total upstream assets could be determined using the reported consolidated
data:
|
|
|
| ($ millions, unless otherwise indicated) |
|
As at
December 31, 2016 |
|
|
| Upstream Property, Plant and Equipment |
|
11,878 |
| Estimated Future Development Capital |
|
18,378 |
| Total Estimated Upstream Cost Base |
|
30,256 |
| Total Proved Reserves (MMBOE) |
|
2,667 |
| Implied Depletion Rate ($/BOE) |
|
11.34 |
While this illustrates the calculation of the implied depletion rate, our depletion rates result in a total average rate
ranging between $10.80 to $11.90 per BOE. Amounts related to assets under construction and assets held for sale, which would be included in the total upstream cost base and would have proved reserves attributed to them, are not depleted. Property
specific rates will exclude upstream assets that are depreciated on a straight-line basis. As such, our actual depletion will differ from depletion calculated by applying the above implied depletion rate. Further information on our accounting policy
for DD&A is included in our notes to the December 31, 2016 Consolidated Financial Statements.
In the first quarter of 2017, Oil Sands
DD&A increased $22 million due to higher sales volumes, partially offset by lower DD&A rates. The average depletion rate was approximately $10.70 per barrel compared with $11.55 per barrel in the first quarter of 2016, declining
primarily due to the impact of proved reserves additions and lower future development costs. Future development costs, which compose approximately 65 percent of the depletable base, declined due to cost savings at both Foster Creek and
Christina Lake related to a reduction in per well costs and increased well pair spacing. This decline was partially offset by an increase in costs related to the expansion of the development area and inclusion of phase G costs at Christina Lake.
There was no exploration expense recorded in the first quarter of 2017 (2016 – $1 million).
Assets and Liabilities Held for Sale
Concurrent with the announcement to acquire ConocoPhillips’ 50 percent interest in FCCL and the majority of ConocoPhillips’ Deep Basin
Assets, we commenced marketing for sale certain non-core properties. This includes our Pelican Lake heavy oil assets, including the adjacent Grand Rapids project in the Greater Pelican region, and our Suffield
crude oil and natural gas assets. As a result, in the Oil Sands segment, our Grand Rapids project was reclassified as held for sale as at March 31, 2017. The assets were recorded at the lesser of their carrying amount and fair value less costs
to sell. The estimated fair value exceeded our carrying value. See the Assets and Liabilities Held for Sale in the Conventional section of this MD&A for more details on the reclassification of our Pelican Lake and Suffield assets.
|
|
|
| Cenovus Energy Inc. First Quarter 2017 Report |
|
Page 24 Management’s
Discussion and Analysis |
CONVENTIONAL
Our
Conventional operations include reliable cash flow producing crude oil and natural gas assets in Alberta and Saskatchewan, including a CO2 enhanced oil recovery project in Weyburn, our heavy
oil asset at Pelican Lake that uses polymer flood and waterflood technology and emerging tight oil assets in Alberta. The established assets in this segment are strategically important for their long life reserves, stable operations and diversity of
crude oil produced. The cash flows generated in our Conventional segment helps to fund future growth opportunities while our natural gas production acts as an economic hedge for the natural gas required as a fuel source at both our oil sands and
refining operations.
Significant developments that impacted our Conventional segment in the first quarter of 2017 compared with 2016 include:
| ● |
|
Our average crude oil sales price increasing 75 percent to $52.13 per barrel; |
| ● |
|
Crude oil and natural gas Netbacks, excluding realized risk management activities, of $23.96 per barrel (2016 –
$7.73 per barrel) and $1.40 per Mcf (2016 – $0.92 per Mcf), respectively; |
| ● |
|
Crude oil production averaging 53,413 barrels per day, decreasing 10 percent primarily due to expected natural
declines; and |
| ● |
|
Generating Operating Margin net of capital investment of $57 million, a decrease of 31 percent due to the more
than doubling of capital investment primarily related to the ramp-up of the tight oil drilling program in Southern Alberta. In 2016, crude oil capital investment activities were limited in response to the low
commodity price environment. |
Conventional – Crude Oil
Financial Results
|
|
|
|
|
|
|
| Three Months Ended March 31, |
| ($ millions) |
|
2017 |
|
|
|
2016 |
|
|
|
|
| Gross Sales |
|
279 |
|
|
|
189 |
| Less: Royalties |
|
46 |
|
|
|
17 |
| Revenues |
|
233 |
|
|
|
172 |
| Expenses |
|
|
|
|
|
|
| Transportation and Blending |
|
47 |
|
|
|
44 |
| Operating |
|
69 |
|
|
|
78 |
| Production and Mineral Taxes |
|
4 |
|
|
|
2 |
| (Gain) Loss on Risk Management |
|
13 |
|
|
|
(40) |
| Operating Margin |
|
100 |
|
|
|
88 |
| Capital Investment |
|
85 |
|
|
|
37 |
| Operating Margin Net of Related Capital Investment |
|
15 |
|
|
|
51 |
Operating Margin Variance
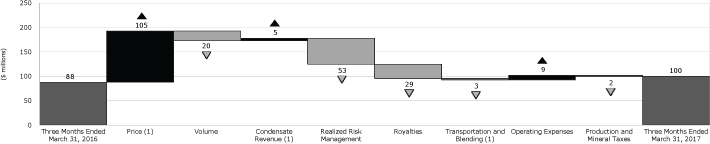
| (1) |
Revenues include the value of condensate sold as heavy oil blend. Condensate costs are recorded in transportation and
blending expense. The crude oil price variance excludes the impact of condensate purchases. |
Revenues
Price
Our Conventional crude oil
assets produce a diverse spectrum of crude oils, ranging from heavy oil, which realizes a price based on the WCS benchmark, to light oil, which realizes a price closer to the WTI benchmark.
Our crude oil sales price averaged $52.13 per barrel in the first quarter of 2017, a 75 percent increase from 2016, due to higher crude oil benchmark
prices, adjusted for applicable differentials, and the narrowing of the WCS-Condensate differential. This increase was partially offset by the strengthening of the Canadian dollar relative to the U.S. dollar.
As the cost of condensate decreases relative to the price of blended crude oil, our heavy oil sales price increases. Due to high demand for condensate at Edmonton, we also purchase condensate from U.S. markets. As such, our average cost of
condensate is generally higher than the Edmonton benchmark price due to transportation between market hubs and to field locations. In addition, up to three months may elapse from when we purchase condensate to when we blend it with our production.
In a rising price environment, we expect to see some benefit in our heavy oil sales price as we are using condensate purchased at a lower price earlier in the year.
|
|
|
| Cenovus Energy Inc. First Quarter 2017 Report |
|
Page 25 Management’s
Discussion and Analysis |
Production Volumes
|
|
|
|
|
|
|
|
|
|
|
| |
|
Three Months Ended March 31, |
| (barrels per day) |
|
2017 |
|
|
|
Percent
Change |
|
|
|
2016 |
|
|
|
|
|
|
| Heavy Oil |
|
27,277 |
|
|
|
(13)% |
|
|
|
31,247 |
| Light and Medium Oil |
|
25,089 |
|
|
|
(7)% |
|
|
|
27,121 |
| NGLs |
|
1,047 |
|
|
|
(13)% |
|
|
|
1,208 |
|
|
53,413 |
|
|
|
(10)% |
|
|
|
59,576 |
Production decreased primarily as a result of expected natural declines.
Condensate
The heavy oil currently
produced by Cenovus must be blended with condensate to reduce its thickness in order to transport it to market through pipelines. Our blending ratios for Conventional heavy oil range between 10 percent and 16 percent. Revenues represent
the total value of blended crude oil sold and includes the value of condensate. Consistent with the narrowing of the WCS-Condensate differential in the first quarter of 2017, the proportion of the cost of
condensate recovered increased.
Royalties
Conventional crude oil royalties increased due to higher sales prices, and lower costs at our Weyburn property, partially offset by a reduction in sales
volumes. In the first quarter of 2017, the effective crude oil royalty rate for our Conventional properties was 20.2 percent (2016 – 12.6 percent).
Crown royalties at Pelican Lake are determined under oil sands royalty calculations. Pelican Lake is a post-payout project, therefore royalties are based
on an annualized calculation which uses the greater of: (1) the gross revenues multiplied by the applicable royalty rate (one to nine percent, based on the Canadian dollar equivalent WTI benchmark price); or (2) the net profits of the
project multiplied by the applicable royalty rate (25 to 40 percent, based on the Canadian dollar equivalent WTI benchmark price). Gross revenues are a function of sales volumes and sales prices. Net profits are a function of sales volumes,
sales prices and allowed operating and capital costs. The Pelican Lake royalty calculation was based on net profits in the first quarter of 2017 and 2016.
In the first quarter of 2017, production and mineral taxes increased slightly related to the rise in crude oil prices.
Expenses
Transportation
and Blending
Transportation and blending costs increased slightly in the first quarter of 2017. Blending costs rose due to higher
condensate prices, partially offset by a decrease in condensate volumes, consistent with lower production. In the first quarter of 2016, as a result of declining crude oil prices, we recorded a $3 million write-down of our blended crude oil
inventory to net realizable value. There was no inventory write-down in 2017. Transportation charges declined primarily due to lower sales volumes.
Operating
Primary drivers of our operating expenses in the first quarter of 2017 were workforce, workovers,
electricity, and property taxes and lease costs.
Operating expenses declined $0.31 per barrel primarily due to:
| ● |
|
Lower chemical costs associated with chemical optimization; |
| ● |
|
A decrease in repairs and maintenance and workover costs due to a focus on critical activities; |
| ● |
|
A decline in electricity costs as a result of a decrease in consumption, slightly offset by a rise in electricity prices;
|
| ● |
|
Lower waste fluid handling and trucking costs associated with pipeline usage optimization; and |
| ● |
|
A decline in workforce costs. |
These declines were partially offset by lower production volumes.
|
|
|
| Cenovus Energy Inc. First Quarter 2017 Report |
|
Page 26 Management’s
Discussion and Analysis |
Netbacks (1)
|
|
|
|
|
|
|
|
|
|
|
|
|
|
|
| |
|
Heavy Oil |
|
|
|
Light and Medium |
| |
|
Three Months Ended March 31, |
| ($/bbl) |
|
2017 |
|
|
|
2016 |
|
|
|
2017 |
|
|
|
2016 |
|
|
|
|
|
|
|
|
| Sales Price |
|
47.77 |
|
|
|
25.99 |
|
|
|
56.84 |
|
|
|
34.36 |
| Royalties |
|
7.03 |
|
|
|
1.40 |
|
|
|
12.75 |
|
|
|
5.18 |
| Transportation and Blending |
|
3.40 |
|
|
|
4.77 |
|
|
|
2.70 |
|
|
|
2.73 |
| Operating Expenses |
|
12.86 |
|
|
|
13.98 |
|
|
|
16.77 |
|
|
|
16.34 |
| Production and Mineral Taxes |
|
0.02 |
|
|
|
- |
|
|
|
1.95 |
|
|
|
0.82 |
| Netback Excluding Realized Risk Management |
|
24.46 |
|
|
|
5.84 |
|
|
|
22.67 |
|
|
|
9.29 |
| Realized Risk Management Gain (Loss) |
|
(3.09) |
|
|
|
7.98 |
|
|
|
(2.51) |
|
|
|
7.90 |
| Netback Including Realized Risk Management |
|
21.37 |
|
|
|
13.82 |
|
|
|
20.16 |
|
|
|
17.19 |
|
(1) Netbacks reflect our margin on a per-barrel basis of unblended crude oil. |
|
|
|
|
|
|
|
|
|
|
|
|
|
|
| Risk Management
Risk management activities for the first quarter resulted in realized losses of
$13 million (2016 – realized gains of $40 million), consistent with average benchmark prices exceeding our contract prices.
Conventional – Natural Gas
Financial Results |
| |
|
|
|
|
|
Three Months Ended March 31, |
| ($ millions) |
|
|
|
|
|
|
|
|
|
2017 |
|
|
|
2016 |
|
|
|
|
|
|
|
|
| Gross Sales |
|
|
|
|
|
|
|
|
|
94 |
|
|
|
82 |
| Less: Royalties |
|
|
|
|
|
|
|
|
|
4 |
|
|
|
3 |
| Revenues |
|
|
|
|
|
|
|
|
|
90 |
|
|
|
79 |
| Expenses |
|
|
|
|
|
|
|
|
|
|
|
|
|
|
| Transportation and Blending |
|
|
|
|
|
|
|
|
|
4 |
|
|
|
3 |
| Operating |
|
|
|
|
|
|
|
|
|
41 |
|
|
|
42 |
| Production and Mineral Taxes |
|
|
|
|
|
|
|
|
|
1 |
|
|
|
- |
| (Gain) Loss on Risk Management |
|
|
|
|
|
|
|
|
|
- |
|
|
|
1 |
| Operating Margin |
|
|
|
|
|
|
|
|
|
44 |
|
|
|
33 |
| Capital Investment |
|
|
|
|
|
|
|
|
|
3 |
|
|
|
2 |
| Operating Margin Net of Related Capital Investment |
|
|
|
|
|
|
|
|
|
41 |
|
|
|
31 |
Operating Margin from natural gas continued to help fund growth opportunities in our Oil Sands segment.
Revenues
Price
In the first quarter of 2017, our average natural gas sales price increased 30 percent to $3.00 per Mcf, consistent with the rise in
the AECO benchmark price.
Production
Production decreased 11 percent to 348 MMcf per day due to expected natural declines.
Royalties
Royalties increased as a
result of higher prices, partially offset by production declines. The average royalty rate in the first quarter was 4.9 percent (2016 – 4.5 percent).
Expenses
Operating
Primary drivers of our operating expenses were property taxes and lease costs, workforce, and repairs and maintenance. In the first quarter, operating
expenses decreased slightly primarily due to a decline in electricity costs.
Risk Management
Risk management activities had no impact in the first quarter of 2017 (2016 – realized losses of $1 million).
|
|
|
| Cenovus Energy Inc. First Quarter 2017 Report |
|
Page 27 Management’s
Discussion and Analysis |
Conventional – Capital Investment
|
|
|
|
|
|
|
|
|
| Three Months Ended March 31, |
| ($ millions) |
|
|
|
2017 |
|
|
|
2016 |
|
|
|
|
|
| Heavy Oil |
|
|
|
8 |
|
|
|
10 |
| Light and Medium Oil |
|
|
|
77 |
|
|
|
27 |
| Natural Gas |
|
|
|
3 |
|
|
|
2 |
| Capital Investment (1) |
|
|
|
88 |
|
|
|
39 |
| (1) |
Includes expenditures on PP&E, E&E assets, and assets held for sale. |
Capital investment in the first quarter of 2017 was primarily related to sustaining capital and tight oil development opportunities in southern Alberta.
Capital investment increased compared with 2016 as a result of limited crude oil capital investment activities in 2016 in response to the low commodity price environment.
Drilling Activity
|
|
|
|
|
|
|
|
|
| Three Months Ended March 31, |
| (net wells, unless otherwise stated) |
|
|
|
2017 |
|
|
|
2016 |
|
|
|
|
|
| Crude Oil |
|
|
|
20 |
|
|
|
1 |
| Recompletions |
|
|
|
- |
|
|
|
65 |
| Gross Stratigraphic Test Wells |
|
|
|
26 |
|
|
|
4 |
Drilling activity in the first quarter of 2017 focused on drilling stratigraphic test wells and horizontal production
wells for tight oil in Southern Alberta.
Future Capital Investment
With the expectation of continued crude oil price volatility in 2017, we are taking a moderate approach to developing our conventional crude oil
opportunities. We plan to focus on drilling projects that are considered to be relatively low risk, with short production cycle times and strong expected returns.
Our 2017 crude oil capital investment forecast is between $275 million and $325 million with spending plans mainly focused on sustaining capital
and tight oil drilling opportunities in southern Alberta. For more information, we direct our readers to review the news release for our 2017 guidance dated December 8, 2016. The news release is available on SEDAR at sedar.com, on EDGAR at
sec.gov, and on our website at cenovus.com.
DD&A and Exploration Expense
We deplete crude oil and natural gas properties on a unit-of-production
basis over proved reserves. The unit-of-production rate takes into account expenditures incurred to date, together with future development expenditures required to
develop those proved reserves. This rate, calculated at an area level, is then applied to our sales volume to determine DD&A in a given period. We believe that this method of calculating DD&A charges each barrel of crude oil equivalent sold
with its proportionate share of the cost of capital invested over the total estimated life of the related asset as represented by proved reserves.
Conventional DD&A declined $201 million in the first quarter of 2017 primarily related to impairment charges of $170 million recorded in the
first quarter of 2016 associated with our Northern Alberta CGU. No impairment charges or reversals were recorded in 2017. In addition, DD&A declined due to lower sales volumes and lower DD&A rates. The average depletion rate
decreased by approximately seven percent in 2017 compared with the first quarter of 2016 primarily due to lower future development costs and a decline in PP&E as a result of the slowdown in our development plans, partially offset by a
decline in proved reserves. Future development costs, which compose approximately 40 percent of the depletable base, declined from 2016 due to minimal capital investment planned at Pelican Lake in the near term.
In 2017, exploration expense was $3 million. There was no exploration expense in 2016.
Assets and Liabilities Held for Sale
Concurrent with the announcement to acquire ConocoPhillips’ 50 percent interest in FCCL and the majority of ConocoPhillips’ Deep Basin
Assets, we commenced marketing for sale certain non-core properties. This includes our Pelican Lake heavy oil assets, including the adjacent Grand Rapids project in the Greater Pelican region, and our Suffield
crude oil and natural gas assets. As a result, in the Conventional segment, our Pelican Lake and Suffield assets were reclassified as held for sale as at March 31, 2017. The assets were recorded at the lesser of their carrying amount and fair
value less costs to sell. The estimated fair value exceeded our carrying value.
|
|
|
| Cenovus Energy Inc. First Quarter 2017 Report |
|
Page 28 Management’s
Discussion and Analysis |
REFINING AND MARKETING
Cenovus is a 50 percent partner in the Wood River and Borger refineries, which are located in the U.S. Our Refining and Marketing segment positions
us to capture the value from crude oil production through to refined products such as diesel, gasoline and jet fuel. Our integrated approach provides a natural economic hedge against widening crude oil price differentials by providing lower
feedstock prices to the Refineries. This segment captures our marketing and transportation initiatives as well as our crude-by-rail terminal operations located in
Bruderheim, Alberta. In the first quarter of 2017, we loaded an average of 11,890 gross barrels per day (2016 – 6,713 gross barrels per day).
Refinery Operations (1)
|
|
|
|
|
|
|
| Three Months Ended March 31, |
| |
|
2017 |
|
|
|
2016 |
| Crude Oil Capacity (Mbbls/d) |
|
460 |
|
|
|
460 |
| Crude Oil Runs (Mbbls/d) |
|
406 |
|
|
|
435 |
| Heavy Crude Oil |
|
200 |
|
|
|
241 |
| Light/Medium |
|
206 |
|
|
|
194 |
| Refined Products (Mbbls/d) |
|
433 |
|
|
|
460 |
| Gasoline |
|
227 |
|
|
|
229 |
| Distillate |
|
131 |
|
|
|
142 |
| Other |
|
75 |
|
|
|
89 |
| Crude Utilization
(percent) |
|
88 |
|
|
|
95 |
| (1) |
Represents 100 percent of the Wood River and Borger refinery operations. |
On a 100-percent basis, the Refineries have a total processing capacity of approximately 460,000 gross barrels per
day of crude oil, including processing capability of up to 255,000 gross barrels per day of blended heavy crude oil and 45,000 gross barrels per day of NGLs. The ability to process a wide slate of crude oils allows the Refineries to economically
integrate heavy crude oil production. Processing less expensive crude oil relative to WTI creates a feedstock cost advantage, illustrated by the discount of WCS relative to WTI. The amount of heavy crude oil processed, such as WCS and CDB, is
dependent on the quality and quantity of available crude oil with the total input slate optimized at each refinery to maximize economic benefit. Crude utilization represents the percentage of total crude oil processed in the Refineries relative to
the total capacity.
In the first quarter of 2017, lower crude oil runs and refined product output reflect the increased scope of planned maintenance
and planned turnarounds at both Refineries. In the first quarter of 2016, planned and unplanned maintenance at the Refineries was completed. In 2017, lower heavy crude oil volumes were processed primarily due to planned turnarounds and optimization
of the total crude input slate.
Refining and Marketing Financial Results
|
|
|
|
|
|
|
|
|
| Three Months Ended March 31, |
| ($ millions) |
|
2017 |
|
|
|
|
2016 |
|
|
|
|
| Revenues |
|
2,604 |
|
|
|
|
|
1,588 |
| Purchased Product |
|
2,330 |
|
|
|
|
|
1,428 |
| Gross Margin |
|
274 |
|
|
|
|
|
160 |
| Expenses |
|
|
|
|
|
|
|
|
| Operating |
|
219 |
|
|
|
|
|
203 |
| (Gain) Loss on Risk Management |
|
2 |
|
|
|
|
|
(20) |
| Operating Margin |
|
53 |
|
|
|
|
|
(23) |
| Capital Investment |
|
46 |
|
|
|
|
|
52 |
| Operating Margin Net of Related Capital Investment |
|
7 |
|
|
|
|
|
(75) |
Gross Margin
The refining realized crack spread, which is the gross margin on a per barrel basis, is affected by many factors, such as the variety of feedstock crude
oil, refinery configuration and the proportion of gasoline, distillate and secondary product output; the time lag between the purchase of crude oil feedstock and the processing of that crude oil through the Refineries; and the cost of feedstock.
Feedstock costs are valued on a FIFO accounting basis.
In the first quarter of 2017, the Refining and Marketing gross margin increased primarily due
to higher average market crack spreads, associated with lower global refined product inventory and widening of the Brent-WTI differential. The increase in gross margin was partially offset by lower crude
utilization rates, a decline in margins on the sale of secondary products, such as coke, asphalt and sulphur due to higher overall feedstock costs, and a stronger Canadian dollar relative to the U.S. dollar, which had a negative impact of
approximately $10 million on the gross margin. In addition, we recorded an inventory write-down of $10 million related to our refined product inventory (2016 – $3 million).
|
|
|
| Cenovus Energy Inc. First Quarter 2017 Report |
|
Page 29 Management’s
Discussion and Analysis |
In the first quarter of 2017, the costs associated with Renewable Identification Numbers (“RINs”)
was $61 million (2016 – $62 million). The costs of RINs remained relatively consistent as the decrease in RINs benchmark prices were offset by an increase in the required RINs volume obligation.
Operating Expense
Primary
drivers of operating expenses in the first quarter of 2017 were maintenance, labour, utilities and supplies. Reported operating expenses increased compared with 2016 primarily due to increased maintenance activities associated with planned
maintenance and turnarounds, and an increase in utility costs resulting from higher natural gas prices, partially offset by the strengthening of the Canadian dollar relative to the U.S. dollar.
Refining and Marketing – Capital Investment
|
|
|
|
|
|
|
| Three Months Ended March 31, |
| ($ millions) |
|
2017 |
|
|
|
2016 |
|
|
|
|
| Wood River Refinery |
|
34 |
|
|
|
36 |
| Borger Refinery |
|
12 |
|
|
|
14 |
| Marketing |
|
- |
|
|
|
2 |
|
|
46 |
|
|
|
52 |
Capital expenditures in the first quarter of 2017 focused on capital maintenance and reliability work. Capital investment
declined $6 million in 2017. In the first quarter of 2016, work continued on the debottlenecking project at the Wood River refinery that was successfully completed in the third quarter of 2016.
In 2017, we expect to invest between $210 million and $240 million mainly related to capital maintenance and reliability work. For more
information, we direct our readers to review the news release for our 2017 guidance dated December 8, 2016. The news release is available on SEDAR at sedar.com, on EDGAR at sec.gov, and on our website at cenovus.com.
DD&A
Refining and the crude-by-rail terminal assets are depreciated on a straight-line basis over the estimated service life of each component of the facilities, which range from three to 40 years.
The service lives of these assets are reviewed on an annual basis. Refining and Marketing DD&A decreased slightly in 2017, primarily due to the change in the U.S./Canadian dollar exchange rate.
CORPORATE AND ELIMINATIONS
The Corporate and Eliminations
segment includes intersegment eliminations relating to transactions that have been recorded at transfer prices based on current market prices, as well as unrealized intersegment profits in inventory. The gains and losses on risk management represent
the unrealized mark-to-market gains and losses related to derivative financial instruments used to mitigate fluctuations in commodity prices, power costs, interest
rates, and foreign exchange rates, as well as realized risk management gains on interest rate swaps and foreign exchange contracts. In the first quarter of 2017, our risk management activities resulted in $279 million of unrealized gains (2016
– unrealized losses of $149 million), including $24 million of unrealized gains related to our foreign exchange contracts entered into in anticipation of the Acquisition. As financial instruments are settled, the realized gains and
losses are recorded in the reportable segment to which the derivative instrument relates.
The Corporate and Eliminations segment also includes
Cenovus-wide costs for general and administrative, financing costs and research costs.
|
|
|
|
|
|
|
|
|
| Three Months Ended March 31, |
| ($ millions) |
|
2017 |
|
|
|
|
2016 |
|
|
|
|
| General and Administrative |
|
43 |
|
|
|
|
|
60 |
| Finance Costs |
|
120 |
|
|
|
|
|
124 |
| Interest Income |
|
(17) |
|
|
|
|
|
(11) |
| Foreign Exchange (Gain) Loss, Net |
|
(76) |
|
|
|
|
|
(403) |
| Transaction Costs |
|
29 |
|
|
|
|
|
- |
| Research Costs |
|
4 |
|
|
|
|
|
18 |
| (Gain) Loss on Divestiture of Assets |
|
1 |
|
|
|
|
|
- |
|
|
104 |
|
|
|
|
|
(212) |
Expenses
General and Administrative
Primary drivers of our general and administrative expenses in 2017 were workforce and
office rent. General and administrative expenses decreased by $17 million primarily due to a decline in long-term employee incentive costs related to a drop in our share price. In addition, we recorded a
non-cash expense of $8 million in the first quarter of 2017 (2016 – $14 million) in connection with certain Calgary office space in excess of Cenovus’s current and near-term requirements.
|
|
|
| Cenovus Energy Inc. First Quarter 2017 Report |
|
Page 30 Management’s
Discussion and Analysis |
Finance Costs
Finance costs include interest expense on our long-term debt and short-term borrowings as well as the unwinding of the discount on decommissioning
liabilities. Finance costs declined $4 million in 2017 compared with the same period in 2016 as strengthening of the Canadian dollar relative to the U.S. dollar decreased interest incurred on our U.S. dollar denominated debt.
The weighted average interest rate on outstanding debt for the first quarter was 5.3 percent (2016 – 5.3 percent).
Foreign Exchange
|
|
|
|
|
|
|
| Three Months Ended March 31, |
| ($ millions) |
|
2017 |
|
|
|
2016 |
|
|
|
|
| Unrealized Foreign Exchange (Gain) Loss |
|
(72) |
|
|
|
(409) |
| Realized Foreign Exchange (Gain) Loss |
|
(4) |
|
|
|
6 |
|
|
(76) |
|
|
|
(403) |
The majority of unrealized foreign exchange gains resulted from the translation of our U.S. dollar denominated debt. The
Canadian dollar relative to the U.S. dollar was one percent stronger at March 31, 2017 compared with December 31, 2016, resulting in unrealized gains.
Transaction Costs
In the first
quarter of 2017, we recorded $29 million of transaction costs related to the Acquisition. See the Transformational Acquisition section of this MD&A for more details on the Acquisition.
DD&A
Corporate and
Eliminations DD&A includes provisions in respect of corporate assets, such as computer equipment, leasehold improvements and office furniture. Costs associated with corporate assets are depreciated on a
straight-line basis over the estimated service life of the assets, which range from three to 25 years. The service lives of these assets are reviewed on an annual basis. DD&A in the first quarter of 2017
was $18 million (2016 – $17 million).
Income Tax
|
|
|
|
|
|
|
| Three Months Ended March 31, |
| ($ millions) |
|
2017 |
|
|
|
2016 |
|
|
|
|
| Current Tax |
|
|
|
|
|
|
| Canada |
|
(21) |
|
|
|
(27) |
| United States |
|
(1) |
|
|
|
- |
| Total Current Tax Expense (Recovery) |
|
(22) |
|
|
|
(27) |
| Deferred Tax Expense (Recovery) |
|
71 |
|
|
|
(190) |
|
|
49 |
|
|
|
(217) |
| The following table reconciles income taxes calculated
at the Canadian statutory rate with the recorded income taxes: |
| Three Months Ended March 31, |
| ($ millions) |
|
2017 |
|
|
|
2016 |
|
|
|
|
| Earnings Before Income Tax |
|
260 |
|
|
|
(335) |
| Canadian Statutory Rate |
|
27.0% |
|
|
|
27.0% |
| Expected Income Tax (Recovery) |
|
70 |
|
|
|
(90) |
| Effect of Taxes Resulting From: |
|
|
|
|
|
|
| Foreign Tax Rate Differential |
|
(15) |
|
|
|
(27) |
| Non-Deductible Stock-Based Compensation |
|
2 |
|
|
|
2 |
| Non-Taxable Capital (Gains) Losses |
|
(7) |
|
|
|
(56) |
| Unrecognized Capital (Gains) Losses Arising From Unrealized Foreign Exchange |
|
(7) |
|
|
|
(56) |
| Other |
|
6 |
|
|
|
10 |
| Total Tax (Recovery) |
|
49 |
|
|
|
(217) |
| Effective Tax Rate |
|
18.8% |
|
|
|
64.8% |
Tax interpretations, regulations and legislation in the various jurisdictions in which Cenovus and its subsidiaries
operate are subject to change. We believe that our provision for income taxes is adequate. There are usually a number of tax matters under review and as a result, income taxes are subject to measurement uncertainty. The timing of the recognition of
income and deductions for the purpose of current tax expense is determined by relevant tax legislation.
|
|
|
| Cenovus Energy Inc. First Quarter 2017 Report |
|
Page 31 Management’s
Discussion and Analysis |
In the first quarter of 2017, a current tax recovery was recorded due to the recognition of prior period
losses. A deferred tax expense was recorded for the quarter compared with a recovery in 2016 due to lower operating losses and unrealized risk management gains compared with losses in the prior year.
Our effective tax rate is a function of the relationship between total tax expense (recovery) and the amount of earnings (loss) before income taxes. The
effective tax rate differs from the statutory tax rate as it reflects higher U.S. tax rates, non-taxable unrealized foreign exchange (gains) losses, adjustments for changes in tax rates and other tax
legislation, adjustments to the tax basis of the refining assets, variations in the estimate of reserves, differences between the provision and the actual amounts subsequently reported on the tax returns, and other permanent differences.
LIQUIDITY AND CAPITAL RESOURCES
|
|
|
|
|
|
|
| Three Months Ended March 31, |
| ($ millions) |
|
2017 |
|
|
|
2016 |
|
|
|
|
| Cash From (Used In) |
|
|
|
|
|
|
| Operating Activities |
|
328 |
|
|
|
182 |
| Investing Activities |
|
(459) |
|
|
|
(369) |
| Net Cash Provided (Used) Before Financing Activities |
|
(131) |
|
|
|
(187) |
| Financing Activities |
|
(52) |
|
|
|
(41) |
| Foreign Exchange Gain (Loss) on Cash and Cash Equivalents Held in Foreign Currency |
|
11 |
|
|
|
6 |
| Increase (Decrease) in Cash and Cash Equivalents |
|
(172) |
|
|
|
(222) |
|
|
|
|
| |
|
March 31,
2017 |
|
|
|
December 31,
2016 |
|
|
|
|
| Cash and Cash Equivalents |
|
3,548 |
|
|
|
3,720 |
| Committed and Undrawn Credit Facilities |
|
4,000 |
|
|
|
4,000 |
Cash From (Used In) Operating Activities
Cash From Operating Activities increased in the first quarter of 2017 mainly due to higher Operating Margin, as discussed in the Financial Results section
of this MD&A. Excluding risk management assets and liabilities and assets and liabilities held for sale, working capital was $4,352 million at March 31, 2017 compared with $4,423 million at December 31, 2016.
The change in non-cash working capital from operating activities for the three months ended March 31, 2017
was primarily due to a decline in accounts receivable, partially offset by a decrease in accounts payable. Accounts receivable declined as a result of lower crude oil sales volumes in March 2017 as compared to December 2016. Accounts payable
declined primarily due to the repayment of a note payable to partner in the first quarter of 2017. In addition, upstream inventory increased primarily due to fulfilling our linefill requirements on the Athabasca Pipeline Twinning Project.
We anticipate that we will continue to meet our payment obligations as they come due.
Cash From (Used In) Investing Activities
In the first quarter of 2017, the change in cash used in investing activities was primarily due to a deposit of $173 million (US$129.5 million)
relating to the Acquisition. The deposit will be applied against the purchase price at the date of closing. See the Transformational Acquisition section of this MD&A for more details.
Cash From (Used In) Financing Activities
In the first quarter of 2017, we paid dividends of $0.05 per share or $41 million (2016 – $0.05 per share or $41 million). The declaration
of dividends is at the sole discretion of the Board and is considered quarterly. Cash used in financing activities also included $10 million of transaction costs related to the Acquisition. See the Transformational Acquisition section of this
MD&A for more details.
Our long-term debt at March 31, 2017 was $6,277 million (December 31, 2016 – $6,332 million) with no
principal payments due until October 2019 (US$1.3 billion). At March 31, 2017, the principal amount of long-term debt outstanding in U.S. dollars remained unchanged since August 2012. The $55 million decrease in long-term debt is
primarily due to strengthening of the Canadian dollar relative to the U.S. dollar.
As at March 31, 2017, we were in compliance with all of the
terms of our debt agreements.
|
|
|
| Cenovus Energy Inc. First Quarter 2017 Report |
|
Page 32 Management’s
Discussion and Analysis |
Available Sources of Liquidity
We expect cash flows from our crude oil, natural gas and refining operations to fund a portion of our cash requirements. Any potential shortfalls may be
required to be funded through prudent use of our balance sheet capacity, management of our asset portfolio and other corporate and financial opportunities that may be available to us.
The following sources of liquidity are available at March 31, 2017:
|
|
|
|
|
|
|
| ($ millions) |
|
Amount |
|
|
|
Term |
|
|
|
|
| Cash and Cash Equivalents |
|
3,548 |
|
|
|
N/A |
| Committed Credit Facility – Tranche B |
|
1,000 |
|
|
|
April 2019 |
| Committed Credit Facility – Tranche A |
|
3,000 |
|
|
|
November 2019 |
| Base Shelf Prospectus
(1) |
|
US$5,000 |
|
|
|
March 2018 |
| (1) |
Availability is subject to market conditions. See below and the Transformational Acquisition section of this MD&A
for details related to the Acquisition. |
Committed Credit Facility
As at March 31, 2017, no amounts had been drawn on our existing committed credit facility. See the Transformational Acquisition section of this
MD&A for information regarding an expected draw at close of the Acquisition.
Under the existing committed credit facility, Cenovus is required to
maintain a debt to capitalization ratio, as defined in the agreement, not to exceed 65 percent; we are well below this limit.
See below for the
Debt to Capitalization ratio used by Cenovus to monitor our capital structure.
Base Shelf Prospectus
In 2016, Cenovus filed a base shelf prospectus. The base shelf prospectus allows us to offer, from time to time, up to US$5.0 billion, or the
equivalent in other currencies, of debt securities, common shares, preferred shares, subscription receipts, warrants, share purchase contracts and units in Canada, the U.S. and elsewhere, where permitted by law. The base shelf prospectus will expire
in March 2018.
As at March 31, 2017, no issuances had been made under the base shelf prospectus. In connection with the Acquisition, on
April 6, 2017, Cenovus closed a Bought-Deal Common Share Offering for 187.5 million common shares under the base shelf prospectus for gross proceeds of $3.0 billion. As at April 6, 2017, US$2.8 billion remains available
under the base shelf prospectus. See the Transformational Acquisition section of this MD&A for more details.
Future
Sources of Liquidity
On March 29, 2017, Cenovus entered into a purchase and sale agreement with ConocoPhillips. To finance a portion
of the cash purchase price, Cenovus closed a Bought-Deal Common Share Offering and a Note Offering in the U.S. in early April 2017. The funds related to Note Offering were placed into escrow subject to closing of the Acquisition. In addition, at
close of the Acquisition we expect to draw under our existing committed credit facility, borrow under a committed Bridge Facility, and use cash on hand to fund the remainder of the purchase price. See the Transformational Acquisition section of the
MD&A for more details.
We remain committed to maintaining our investment grade credit ratings from S&P Global Ratings and DBRS Limited as
well as the investment grade credit rating we recently received from Fitch Ratings.
Financial Measures
We monitor our capital structure and financing requirements using, among other things, non-GAAP financial measures
consisting of Debt to Capitalization and Debt to Adjusted EBITDA. We define our non-GAAP measure of Debt as short-term borrowings and the current and long-term portions of long-term debt. We define
Capitalization as Debt plus Shareholders’ Equity. We define Adjusted EBITDA as earnings before finance costs, interest income, income tax expense, DD&A, goodwill impairments, asset impairments and reversals, unrealized gains (losses) on
risk management, foreign exchange gains (losses), gains (losses) on divestiture of assets and other income (loss), net, calculated on a trailing 12-month basis. These measures are used to steward our overall
debt position and as measures of our overall financial strength.
|
|
|
| Cenovus Energy Inc. First Quarter 2017 Report |
|
Page 33 Management’s
Discussion and Analysis |
Over the long-term, we target a Debt to Capitalization ratio of between 30 percent to 40 percent
and a Debt to Adjusted EBITDA of between 1.0 times to 2.0 times. At different points within the economic cycle, we expect these ratios may periodically be outside of the target range.
|
|
|
|
|
| |
|
March 31, |
|
December 31, |
| As at |
|
2017 |
|
2016 |
|
|
|
| Net Debt to Capitalization (1) (2) |
|
19% |
|
18% |
| Debt to Capitalization |
|
35% |
|
35% |
| Net Debt to Adjusted EBITDA (1) |
|
1.6x |
|
1.9x |
| Debt to Adjusted EBITDA |
|
3.7x |
|
4.5x |
| (1) |
Net Debt is defined as Debt net of Cash and Cash Equivalents. |
| (2) |
Net Debt to Capitalization is defined as Net Debt divided by Net Debt plus Shareholders’ Equity.
|
Debt to Capitalization remained consistent as lower debt balances from the strengthening of the Canadian dollar relative to the
U.S. dollar were offset by higher net earnings primarily related to the increase in commodity prices. Debt to Adjusted EBITDA declined as a result of higher Adjusted EBITDA, primarily due to an increase in commodity prices, partially offset by the
lower long-term debt balance.
Additional information regarding our financial measures and capital structure can be found in the notes to the
December 31, 2016 Consolidated Financial Statements and the March 31, 2017 interim Consolidated Financial Statements.
Share Capital and Stock-Based Compensation Plans
As part of our long-term incentive program, Cenovus has an employee Stock Option Plan as well as Performance Share Unit (“PSU”) Plan, a
Restricted Share Unit (“RSU”) Plan and two Deferred Share Unit (“DSU”) Plans. Certain directors, officers or employees chose prior to December 31, 2016 to convert a portion of their remuneration, paid in the first quarter of
2017, into DSUs. The election for any particular year is irrevocable. DSUs may not be redeemed until departure. Directors also received an annual grant of DSUs.
Refer to Note 18 of the interim Consolidated Financial Statements for more details on our Stock Option Plan and our PSU, RSU and DSU Plans.
|
|
|
|
|
|
|
| As at March 31, 2017 |
|
Units
Outstanding (thousands) |
|
|
|
Units
Exercisable (thousands) |
|
|
|
|
| Common Shares |
|
833,290 |
|
|
|
N/A |
| Stock Options |
|
42,569 |
|
|
|
37,176 |
| Other Stock-Based Compensation Plans (1) |
|
10,280 |
|
|
|
1,707 |
| (1) |
Includes PSUs, RSUs, and DSUs. |
Contractual Obligations and Commitments
Cenovus has obligations for goods and services that were entered into in the normal course of business. Obligations are primarily related to demand
charges on firm transportation agreements, operating leases on buildings, our risk management program and an obligation to fund our defined benefit pension and other post-employment benefit plans. Obligations that have original maturities of less
than one year are excluded. For further information, see the notes to the December 31, 2016 Consolidated Financial Statements.
In the first
quarter of 2017, total commitments were $26.7 billion, of which $23.2 billion were for various transportation commitments. In 2017, transportation commitments decreased by $3.1 billion from December 31, 2016 primarily due to our
withdrawal from certain transportation initiatives. Transportation commitments include $16 billion that are subject to regulatory approval or have been approved but are not yet in service (2016 – $19 billion). Terms are up to 20 years
subsequent to the date of commencement and should help align our future transportation requirements with our anticipated production growth.
As at
March 31, 2017, there were outstanding letters of credit aggregating $254 million issued as security for performance under certain contracts (December 31, 2016 – $258 million).
In the normal course of business, we also lease office space for staff who support field operations and for corporate purposes.
Legal Proceedings
We are involved in a limited number of legal claims associated with the normal course of operations. We believe that any liabilities that might arise from
such matters, to the extent not provided for, are not likely to have a material effect on our interim Consolidated Financial Statements.
|
|
|
| Cenovus Energy Inc. First Quarter 2017 Report |
|
Page 34 Management’s
Discussion and Analysis |
RISK MANAGEMENT
For a full understanding of the risks that
impact Cenovus, the following discussion should be read in conjunction with the Risk Management section of our 2016 annual MD&A. A description of the risk factors and uncertainties can be found in the Advisory and a full discussion of the
material risk factors affecting Cenovus can be found in our AIF for the year ended December 31, 2016.
Cenovus is exposed to a number of
risks through the pursuit of our strategic objectives. Some of these risks impact the oil and gas industry as a whole and others are unique to our operations. Actively managing these risks improves our ability to effectively execute our business
strategy. We continue to be exposed to the risks identified in our 2016 annual MD&A.
The following provides an update on our risks related to
commodity prices, foreign exchange rates, as well as risks related to the Acquisition.
Commodity Price Risk
Fluctuations in commodity prices and refined product prices impacts our financial condition, results of operations, cash flows, growth, access to capital
and cost of borrowing.
We partially mitigate our exposure to commodity price risk through the integration of our business, financial instruments,
physical contracts and market access commitments. Financial instruments undertaken within our refining business by the operator, Phillips 66, are primarily for purchased product. For details of our financial instruments, including classification,
assumptions made in the calculation of fair value and additional discussion on exposure of risks and the management of those risks, see Notes 20 and 21 to the interim Consolidated Financial Statements.
Risks Associated with Derivative Financial Instruments
Financial instruments expose Cenovus to the risk that a counterparty will default on its contractual obligations. This risk is partially mitigated through
credit exposure limits, frequent assessment of counterparty credit ratings and netting arrangements, as outlined in our Credit Policy.
Financial
instruments also expose Cenovus to the risk of a loss from adverse changes in the market value of financial instruments or if we are unable to fulfill our delivery obligations related to the underlying physical transaction. Financial instruments may
limit the benefit to Cenovus if commodity prices increase. These risks are minimized through hedging limits that are reviewed annually by the Board, as required by our Market Risk Mitigation Policy.
Impact of Financial Risk Management Activities
|
|
|
|
|
|
|
|
|
|
|
|
|
|
|
| |
|
Three Months Ended March 31, |
| |
|
2017 |
|
|
|
2016 |
| ($ millions) |
|
Realized |
|
Unrealized |
|
Total |
|
|
|
Realized |
|
Unrealized |
|
Total |
|
|
|
|
|
|
|
|
| Crude Oil |
|
90 |
|
(251) |
|
(161) |
|
|
|
(164) |
|
118 |
|
(46) |
| Refining |
|
2 |
|
- |
|
2 |
|
|
|
(4) |
|
3 |
|
(1) |
| Power |
|
- |
|
- |
|
- |
|
|
|
3 |
|
(14) |
|
(11) |
| Interest Rate |
|
- |
|
(4) |
|
(4) |
|
|
|
- |
|
42 |
|
42 |
| Foreign Exchange |
|
- |
|
(24) |
|
(24) |
|
|
|
- |
|
- |
|
- |
| (Gain) Loss on Risk Management |
|
92 |
|
(279) |
|
(187) |
|
|
|
(165) |
|
149 |
|
(16) |
| Income Tax Expense (Recovery) |
|
(24) |
|
75 |
|
51 |
|
|
|
43 |
|
(41) |
|
2 |
| (Gain) Loss on Risk Management, After Tax |
|
68 |
|
(204) |
|
(136) |
|
|
|
(122) |
|
108 |
|
(14) |
In the first quarter of 2017, we recorded realized losses on crude oil risk management activities, consistent with the
average benchmark price exceeding our contract prices. We recorded unrealized gains on our crude oil financial instruments primarily due to the realization of settled positions and changes in market prices.
Foreign Exchange Rates
Our revenues are subject to foreign exchange exposure as the sales prices of our crude oil, natural gas and refined products are determined by reference
to U.S. benchmark prices. A decrease in the value of the Canadian dollar compared with the U.S. dollar has a positive impact on our reported results. Likewise, as the Canadian dollar strengthens, our reported results are lower. In addition to
our revenues being denominated in U.S. dollars, we have chosen to borrow U.S. dollar long-term debt. In periods of a weakening Canadian dollar, our U.S. dollar debt gives rise to unrealized foreign exchange losses when translated to Canadian
dollars. To manage exposure to exchange rate fluctuations, Cenovus periodically enters into foreign exchange contracts. As at March 31, 2017, we had a notional amount of US$4.8 billion in foreign exchange forwards and options entered into
in anticipation of the Acquisition. See the Transformational Acquisition section of this MD&A for more details. Exchange rate fluctuations could have a material adverse effect on our financial condition, results of operations and cash flows.
|
|
|
| Cenovus Energy Inc. First Quarter 2017 Report |
|
Page 35 Management’s
Discussion and Analysis |
Risks Related to the Acquisition
Possible Failure to Complete or Delay in Completion of the Acquisition
The closing of the Acquisition is subject to the required regulatory approvals and the satisfaction of certain closing conditions. The closing of the
Acquisition will also require us to draw on our existing committed credit facility and a committed Bridge Facility, which have certain conditions. There is no certainty, nor can we provide any assurance, that these conditions will be satisfied or,
if satisfied, when they will be satisfied. If they are not satisfied or waived, the Acquisition will not be completed. In addition, a substantial delay in obtaining regulatory approvals or the imposition of unfavourable terms or conditions in the
approvals could have a material adverse effect on our ability to complete the Acquisition and on our business, financial condition or results of operations following the Acquisition. If the Acquisition is not completed as contemplated, we could
suffer adverse consequences, including the loss of investor confidence. In addition, if the Acquisition is not completed we would have discretion as to the use of the net proceeds of the Bought-Deal Common Share Offering, as described below.
Discretion as to the Use of Proceeds From the Bought-Deal Common Share Offering if the Acquisition is not Completed
We intend to use the net proceeds of the Bought-Deal Common Share Offering, together with the Note Offering, borrowings under our
existing committed credit facility, a committed Bridge Facility, and a portion of our cash on hand to pay the cash purchase price and pay certain fees and expenses related to the Acquisition. However, the Acquisition is subject to the satisfaction
or waiver of certain conditions, some of which are beyond our control, and the Bought-Deal Common Share Offering was not conditional upon the consummation of the Acquisition. There can be no assurances that the Acquisition will occur on the terms
set forth in the Acquisition Agreement or at all. In the event that the Acquisition is not completed, we may use the net proceeds of the Bought-Deal Common Share Offering to, among other things, reduce our indebtedness, finance future growth
opportunities including acquisitions and investments, finance our capital expenditures, repurchase outstanding Common Shares or for general corporate purposes. Accordingly, our management and Board of Directors would have discretion as to the use of
the net proceeds of the Bought-Deal Common Share Offering, and there can be no assurance as to how the net proceeds would be reallocated.
Unexpected Costs or Liabilities Related to the Acquisition
Acquisitions of crude oil and natural gas properties
are based largely on engineering, environmental and economic assessments made by the acquiror, independent engineers and consultants. These assessments include a series of assumptions regarding such factors as recoverability and marketability of
crude oil and natural gas, environmental restrictions and prohibitions regarding releases and emissions of various substances, future prices of crude oil and natural gas and operating costs, future capital expenditures and royalties and other
government levies which will be imposed over the producing life of the reserves. Many of these factors are subject to change and are beyond our control. All such assessments involve a measure of geologic, engineering, environmental and regulatory
uncertainty that could result in lower production and reserves or higher operating or capital expenditures than anticipated.
Although we conducted
title and environmental reviews in respect of the Deep Basin Assets, such reviews cannot guarantee that any unforeseen defects in the chain of title will not arise to defeat our title to certain assets or that environmental defects or deficiencies
do not exist.
In connection with the Acquisition, there may be liabilities that we failed to discover or were unable to quantify in our due diligence
conducted prior to the execution of the Acquisition Agreement and we may not be indemnified for some or all of these liabilities. The discovery or quantification of any material liabilities could have a material adverse effect on our business,
financial condition or future prospects. In addition, the Acquisition Agreement limits the amount for which we are indemnified, such that liabilities in respect of the Acquisition may be greater than the amounts for which we are indemnified under
the Acquisition Agreement.
Realization of Acquisition Benefits
We believe that the Acquisition will provide a number of benefits to Cenovus. However, there is a risk that some or all of the expected benefits of the
Acquisition may fail to materialize, may cost more to achieve or may not occur within the time periods that we anticipate. The realization of such benefits may be affected by a number of factors, many of which are beyond our control.
Amount of Contingent Payments
In connection with the Acquisition, we have agreed to make contingent payments under certain circumstances. The amount of contingent payments will vary
depending on the WCS price from time to time during the five year period following the closing of the Acquisition, and such payments may be significant. In addition, in the event that such payments are made, this could have an adverse impact on our
reported results and other metrics.
|
|
|
| Cenovus Energy Inc. First Quarter 2017 Report |
|
Page 36 Management’s
Discussion and Analysis |
Significant Transaction and Related Costs
We expect to incur a number of costs associated with completing the Acquisition, integrating the Deep Basin Assets and completing the targeted asset
sales. The majority of such costs will consist of transaction costs related to the Acquisition, facilities and systems consolidation costs and employment-related costs. Additional unanticipated costs may be incurred in the integration of the assets
to be acquired under the Acquisition (collectively, the “Acquired Assets”) into our business and completing the targeted asset sales.
Operational and Reserves and Resources Risks Relating to the Acquired Assets
The risk factors set forth in our
AIF relating to the crude oil and natural gas business, environmental matters and the operations and reserves and resources of Cenovus apply equally in respect of the Acquired Assets. In particular, the reserves, resources and recovery information
contained in the reserves and resources reports in respect of the Acquired Assets is only an estimate and the actual production from and ultimate reserves of those properties may be greater or less than the estimates contained in such reports.
Risk of Default in the Repayment of Borrowings under the Acquisition Credit Facilities
We anticipate incurring material indebtedness under our existing committed credit facility and a committed Bridge Facility. We intend to repay borrowings
under the committed Bridge Facility through the sale of certain of our assets. We may not be able to sell such assets in the time period we estimate, or for prices we expect to realize from such sales. If we are unable to sell such assets on the
terms that we expect to receive, or at all, our ability to repay borrowings under the committed Bridge Facility as anticipated could be adversely affected. In the event we are unable to refinance borrowings we incur under our existing committed
credit facility or committed Bridge Facility in the manner intended, we may be required to utilize other sources of liquidity including cash on hand, cash from operating activities or borrowings under our existing committed credit facility to the
extent of any availability thereunder. We may also be required to seek extensions to or modifications of the terms of our existing committed credit facility or committed Bridge Facility in order to defer the maturity dates of borrowings incurred
thereunder. In recent years, depressed prices for crude oil and natural gas have materially affected the operating and financial performance of borrowers in the energy sector which has at times resulted in the curtailment of the availability of
credit from lenders, and an unwillingness to provide borrowers with desired extensions to, or other modifications of, repayment terms. As a result, depending on crude oil and natural gas and credit market conditions at the time when borrowings under
our existing committed credit facility or committed Bridge Facility are due for repayment, and our own financial performance at that time, we may be unable to obtain extensions or modifications of the terms of our existing committed credit facility
or committed Bridge Facility on terms satisfactory to us, or at all, which could result in us defaulting on our repayment obligations under our existing committed credit facility or committed Bridge Facility and being subject to various remedies
available to the lenders thereunder including remedies available under applicable bankruptcy and insolvency legislation.
Increased Indebtedness
If the Acquisition is consummated on the terms contemplated in the Acquisition Agreement, we anticipate that we will borrow up to $4.6 billion,
through drawdowns on our existing committed credit facility and committed Bridge Facility, and by the issuance of US$2.9 billion in senior unsecured notes. Such borrowings will represent a significant increase in Cenovus’s consolidated
indebtedness. Such additional indebtedness will increase Cenovus’s interest expense and debt service obligations and may have a negative effect on Cenovus’s results of operations.
Cenovus’s ability to service its increased debt will depend upon, among other things, its future financial and operating performance, which will be
affected by prevailing economic conditions, interest rate fluctuations and financial, business, regulatory and other factors, some of which are beyond Cenovus’s control. If Cenovus’s operating results are not sufficient to service its
current or future indebtedness, Cenovus may be forced to take actions such as reducing dividends, reducing or delaying business activities, investments or capital expenditures, selling assets, restructuring or refinancing its debt, or seeking
additional equity capital.
Our credit ratings could be lowered or withdrawn entirely by a rating agency if, in its judgment, the circumstances
warrant. The increased indebtedness of Cenovus arising from the Acquisition could be a factor considered by the ratings agencies in downgrading Cenovus’s credit rating. If a rating agency were to downgrade Cenovus’s credit rating,
Cenovus’s borrowing costs could increase and its funding sources could decrease. In addition, a failure by Cenovus to maintain its current credit ratings could affect its business relationships with suppliers and operating partners. A credit
downgrade could also adversely affect the availability and cost of capital needed to fund the growth investments that are a central element to Cenovus’s long-term business strategy.
Exchange Rate Risk
In addition to the net proceeds of the Bought-Deal Common Share Offering and the Note Offering, advances under our existing committed credit facility and
committed Bridge Facility will be used to finance a portion of the cash purchase price. As we will fund a portion of the cash purchase price from a combination of Canadian and U.S. dollar denominated sources, and the cash purchase price of the
Acquisition is denominated in U.S. dollars, a significant decline in the value of the Canadian dollar relative to the U.S. dollar at the time of closing of the Acquisition could increase the cost to Cenovus of financing the cash purchase price in
Canadian dollar terms. Future events that may significantly increase or decrease the risk of future movement in the exchange rates cannot be predicted.
|
|
|
| Cenovus Energy Inc. First Quarter 2017 Report |
|
Page 37 Management’s
Discussion and Analysis |
British Columbia Exposure
Pursuant to the Acquisition, we will acquire approximately 0.9 million gross acres (0.7 million net acres) of land holdings in British Columbia,
which exposes us to the following additional risks.
Aboriginal Claims
Aboriginal groups have claimed aboriginal title and rights to portions of western Canada, including British Columbia, and such claims, if successful,
could have a material negative impact on Cenovus. The Governments of Canada and British Columbia have a duty to consult with Aboriginal people in relation to actions and decisions which may impact those rights and claims and, in certain cases, have
a duty to accommodate their concerns. These duties have the potential to adversely affect Cenovus’s ability to obtain and renew permits, leases, licenses and other approvals, or to meet the terms and conditions of those approvals. The scope of
the duty to consult by the federal Government of Canada and the Government of British Columbia is subject to ongoing litigation which may result in uncertainty with respect to the process to obtain permits, leases, licenses and other approvals.
Opposition by Aboriginal groups may also negatively impact Cenovus in terms of public perception, diversion of management’s time and resources, legal and other advisory expenses, potential blockades or other interference by third parties in
Cenovus’s operations, or court-ordered relief impacting Cenovus’s operations. Challenges by Aboriginal groups could adversely impact Cenovus’s progress and ability to explore and develop its properties.
Climate Change Regulation
On August 19, 2016, the Government of British Columbia unveiled its Climate Leadership Plan with a goal to reduce net annual GHG emissions by up to
25 million tonnes below current forecasts by 2050, and reaffirmed that it will achieve its 2050 target of an 80 percent reduction in emissions from 2007 levels. In addition to various measures across the economy that are designed to
incentivize the growth of the renewable energy sector, the use of low GHG emitting technologies, and the improvement of energy efficiency, among other goals, the Government of British Columbia has committed to implementing a formal policy to
regulate carbon capture and storage projects.
Further, the Climate Leadership Plan sets out a strategy to reduce methane emissions in the upstream
natural gas sector, beginning with a Legacy phase that targets a 45 percent reduction in fugitive and vented emissions by 2025 for facilities built before January 1, 2015, followed by a Transition phase for facilities built between 2015
and 2018 that will involve a new offset protocol and a Clean Infrastructure Royalty Credit Program, and finally a Future phase that will include the development and implementation of new methane emissions reduction standards.
Environmental Regulation
In British Columbia, the Oil and Gas Activities Act (the “OGAA”) impacts conventional crude oil and natural gas producers, shale gas producers
and other operators of crude oil and natural gas facilities in the province. Under the OGAA, the British Columbia Oil and Gas Commission (the “Commission”) has broad powers, particularly with respect to compliance and enforcement and the
setting of technical safety and operational standards for oil and natural gas activities. The Environmental Protection and Management Regulation establishes the government’s environmental objectives for Crown lands for water, riparian habitats,
wildlife and wildlife habitat, old-growth forests and cultural heritage resources. The OGAA requires the Commission to consider these environmental objectives in deciding whether or not to authorize an oil and
gas activity. In addition, although not exclusively an environmental statute, the Petroleum and Natural Gas Act, in conjunction with the OGAA, requires proponents to obtain various approvals before undertaking exploration or production work, such as
geophysical licences, geophysical exploration project approvals, permits for the exclusive right to do geological work and geophysical exploration work, and well, test hole and water-source well authorizations. Such approvals are given subject to
environmental considerations and licences and project approvals can be suspended or cancelled for failure to comply with this legislation or its regulations.
Royalty Regime
Producers of crude oil and natural gas from Crown lands in British Columbia are required to pay annual rental payments, and make monthly royalty payments
in respect of crude oil and natural gas produced. The amount payable as a royalty in respect of crude oil depends on the type and vintage of the crude oil, the quantity of crude oil produced in a month and the value of that crude oil. Generally,
crude oil is classified as either light or heavy and the vintage of crude oil is classified as either: “old oil” that is produced from a pool with a completed well that first recovered crude oil before October 31, 1975; “new
oil” that is produced from a pool with a completed well that first recovered oil between October 31, 1975 and June 1, 1998; or “third-tier oil” that is produced from a pool with a completed well that first recovered crude
oil after June 1, 1998 or through an enhanced oil recovery scheme. The royalty calculation takes into account the production of crude oil on a well-by-well basis,
the specified royalty rate for a given vintage of crude oil, the average unit-selling price of the crude oil and any applicable royalty exemptions. Royalty rates are reduced on low-productivity wells,
reflecting the higher unit costs of extraction, and are the lowest for third-tier oil, reflecting the higher unit costs of both exploration and extraction.
The royalty payable in respect of natural gas produced on Crown lands is determined by a sliding scale formula based on a reference price, which is the
greater of the average net price obtained by the producer and a prescribed minimum price. For non-conservation gas (not produced in association with crude oil), the royalty rate depends on the date of
acquisition of the crude oil and natural gas tenure rights and the spud date of the well, and may also be
|
|
|
| Cenovus Energy Inc. First Quarter 2017 Report |
|
Page 38 Management’s
Discussion and Analysis |
impacted by the select price, a parameter used in the royalty rate formula to account for inflation. Royalty rates are fixed for certain classes of
non-conservation gas when the reference price is below the select price. Conservation gas is subject to a lower royalty rate than non-conservation gas. Royalties on NGLs
are levied at a flat rate of 20 percent of sales volume.
Producers of crude oil and natural gas from freehold lands in British Columbia are
required to pay monthly freehold production taxes. For crude oil, the applicable freehold production tax is based on the volume of monthly production, and is either a flat rate, or, beyond a certain production level, is determined using a sliding
scale formula based on the production level. For natural gas, the applicable freehold production tax is a flat rate, or, at certain production levels, is determined using a sliding scale formula based on the reference price similar to that applied
to natural gas production on Crown land, and depends on whether the natural gas is conservation gas or non-conservation gas. The production tax rate for freehold NGLs is a flat rate of 12.25 percent.
Additionally, owners of mineral rights in British Columbia must pay an annual mineral land tax that is equivalent to $4.94 per hectare of producing lands. Non-producing lands are taxed on a sliding scale
between $1.25 – $4.94 per hectare, depending on the total number of hectares owned by the entity.
The Government of British Columbia maintains a
number of targeted royalty programs for key resource areas intended to increase the competitiveness of British Columbia’s low productivity natural gas wells. These include both royalty credit and royalty reduction programs.
The Government of British Columbia also maintains an Infrastructure Royalty Credit Program that provides royalty credits for up to 50 percent of the
cost of certain approved road construction or pipeline infrastructure projects intended to facilitate increased crude oil and natural gas exploration and production in under-developed areas and to extend the drilling season.
Other Risks
U.S. Administration
Recent changes to the federal administration in the U.S. may result in legislative and
regulatory changes that could have an adverse effect on Cenovus. In particular, the 2016 U.S. presidential election and the related changes in political agenda, coupled with the transition of administration, has created uncertainty as to the
position the U.S. federal government will take with respect to world affairs and events. This uncertainty may include issues such as U.S. support for existing treaty and trade relationships with other countries, including Canada. In particular,
proposals to implement a border adjustment tax may, if implemented, lead to unfavourable tax treatment on goods imported to the U.S. from Canada, and have a significant impact on Canadian companies that do business in the U.S. Implementation by the
U.S. government of new legislative or regulatory policies could impose additional costs on Cenovus, decrease U.S. demand for Cenovus’s products, or otherwise negatively impact Cenovus, which may have a material adverse effect on our business,
financial condition and operations. In addition, this uncertainty may adversely impact (a) the ability or willingness of Canadian companies to transact business with companies such as Cenovus whose products are being exported to the U.S.; (b)
our profitability, particularly if the U.S. imposes any border adjustment taxes and/or the Government of Canada imposes new restrictions on imports from the U.S.; (c) regulation and trade agreements affecting the U.S. and Canada; (d) global
stock markets (including the TSX); and (e) general global economic conditions. All of these factors are outside of our control, but may nonetheless lead us to adjust our strategy in order to compete effectively in global markets.
CRITICAL ACCOUNTING JUDGMENTS, ESTIMATES AND ACCOUNTING POLICIES
Management is required to make estimates and
assumptions, and use judgment in the application of accounting policies that could have a significant impact on our financial results. Actual results may differ from estimates and those differences may be material. The estimates and assumptions used
are subject to updates based on experience and the application of new information. Our critical accounting policies and estimates are reviewed annually by the Audit Committee of the Board. Further details on the basis of preparation and our
significant accounting policies can be found in the notes to the Consolidated Financial Statements and annual MD&A for the year ended December 31, 2016.
Critical Judgments in Applying Accounting Policies
Critical judgments are those judgments made by Management in the process of applying accounting policies that have the most significant effect on the
amounts recorded in our annual and interim Consolidated Financial Statements. There have been no changes to our critical judgments used in applying accounting policies during the three months ended March 31, 2017. Further information can be
found in the notes to the Consolidated Financial Statements and annual MD&A for the year ended December 31, 2016.
|
|
|
| Cenovus Energy Inc. First Quarter 2017 Report |
|
Page 39 Management’s
Discussion and Analysis |
Key Sources of Estimation Uncertainty
Critical accounting estimates are those estimates that require Management to make particularly subjective or complex judgments about matters that are
inherently uncertain. Estimates and underlying assumptions are reviewed on an ongoing basis and any revisions to accounting estimates are recorded in the period in which the estimates are revised. There have been no changes to our key sources of
estimation uncertainty during the three months ended March 31, 2017. Further information can be found in the notes to the Consolidated Financial Statements and annual MD&A for the year ended December 31, 2016.
Changes in Accounting Policies
There were no new or amended accounting standards or interpretations adopted during the three months ended March 31, 2017.
New Accounting Standards and Interpretations not yet Adopted
A number of new accounting standards, amendments to accounting standards and interpretations are effective for annual periods beginning on or after
January 1, 2017 and have not been applied in preparing the interim Consolidated Financial Statements for the period ended March 31, 2017. The following provides an update to the disclosure in the annual Consolidated Financial Statements
for the year ended December 31, 2016:
Revenue Recognition
On May 28, 2014, the IASB issued IFRS 15, “Revenue From Contracts With Customers” (“IFRS 15”) replacing IAS 11,
“Construction Contracts”, IAS 18, “Revenue” and several revenue-related interpretations. IFRS 15 establishes a single revenue recognition framework that applies to contracts with customers. The standard requires an
entity to recognize revenue to reflect the transfer of goods and services for the amount it expects to receive, when control is transferred to the purchaser. Disclosure requirements have also been expanded.
IFRS 15 is effective for annual periods beginning on or after January 1, 2018. The standard may be applied retrospectively or using a modified
retrospective approach. We are currently evaluating the impact of adopting IFRS 15 on the Consolidated Financial Statements and plan to adopt the standard for the year ended December 31, 2018.
Leases
On January 13, 2016,
the IASB issued IFRS 16, “Leases” (“IFRS 16”), which requires entities to recognize lease assets and lease obligations on the balance sheet. For lessees, IFRS 16 removes the classification of leases as either operating
leases or finance leases, effectively treating all leases as finance leases. Certain short-term leases (less than 12 months) and leases of low-value assets are exempt from the requirements, and may continue to
be treated as operating leases.
Lessors will continue with a dual lease classification model. Classification will determine how and when a lessor
will recognize lease revenue, and what assets would be recorded.
IFRS 16 is effective for years beginning on or after January 1, 2019, with
early adoption permitted if IFRS 15 has been adopted. The standard may be applied retrospectively or using a modified retrospective approach. The modified retrospective approach does not require restatement of prior period financial information as
it recognizes the cumulative effect as an adjustment to opening retained earnings and applies the standard prospectively.
We plan to apply IFRS 16 on
January 1, 2019. A transition team is assessing the impacts of adopting IFRS 16 and will oversee changes to accounting systems, processes and internal controls. The estimated time and effort necessary to develop and implement required changes
(including the impact to information technology systems) extends into 2018. Although the transition approach on adoption has not yet been determined, it is anticipated that the adoption of IFRS 16 will have a material impact on the Consolidated
Balance Sheets.
CONTROL ENVIRONMENT
There have been no changes to internal control over financial reporting (“ICFR”) during the three months ended March 31, 2017 that have
materially affected, or are reasonably likely to materially affect, ICFR.
Internal control systems, no matter how well designed, have inherent
limitations. Therefore, even those systems determined to be effective can provide only reasonable assurance with respect to financial statement preparation and presentation. Also, projections of any evaluation of effectiveness to future periods are
subject to the risk that controls may become inadequate because of changes in conditions, or that the degree of compliance with the policies or procedures may deteriorate.
|
|
|
| Cenovus Energy Inc. First Quarter 2017 Report |
|
Page 40 Management’s
Discussion and Analysis |
OUTLOOK
We expect 2017 will be a transformational year
for Cenovus. The Acquisition will increase our interest in FCCL to 100 percent and the Deep Basin Assets will give us an additional growth platform in Alberta and British Columbia. The Acquisition, which is subject to customary closing
conditions and regulatory requirements, will have an effective date of January 1, 2017 and is expected to close in the second quarter of 2017.
Additional information on our spending plans, and the potential impact of the Acquisition, is available in our material change report dated April 5,
2017 available on SEDAR and EDGAR. We also intend to provide updated guidance after closing of the Acquisition and at our Investor Day in June 2017.
We are well-positioned for what is anticipated to be another year of market and commodity price volatility. We will continue to look for ways to increase
our margins through strong operating performance and cost leadership, while delivering safe and reliable operations. Proactively managing our market access commitments and opportunities will assist with our goal of reaching a broader customer base
to secure a higher sales price for our crude oil.
We have reduced the amount of capital needed to sustain our base business and expand our projects,
which will allow us to reactivate growth in a disciplined manner. Together, these efforts will help to ensure our financial resilience.
The following outlook
commentary is focused on the next twelve months.
Commodity Prices Underlying our Financial Results
Our crude oil pricing outlook is influenced by the following:
| ● |
|
We expect the general outlook for crude oil prices will be tied primarily to the supply response to the current price
environment, compliance of OPEC and select non-OPEC countries with the plan to reduce production, the impact of geopolitical supply disruptions, and the pace of growth in global demand as influenced by
macro-economic events. Overall, we expect a modest crude oil price improvement in the next twelve months. |
|
| ● |
|
We anticipate that the WTI-WCS differential will widen due to increasing heavy
oil production in Alberta and limited pipeline capacity. |
|
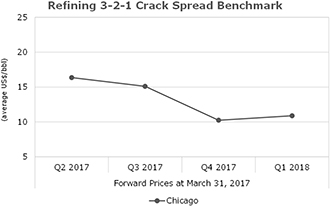
U.S. refining crack spreads are
expected to follow historical seasonal patterns over the next twelve months as we expect that they will be impacted by the pace of rebalancing excess crude oil and refined product inventories.
The Canadian dollar will likely continue to be tied to crude oil prices, tempered by expectations of rising interest rates in the U.S. Overall, excluding
the change in crude oil prices, a stronger Canadian dollar is expected to have a negative impact on our revenues and Operating Margin.
Natural gas
prices are anticipated to improve in the next twelve months due to limited supply growth, strengthening U.S. industrial demand, and an increase in U.S. natural gas export capacity. We expect that supply growth will be impacted by a relatively low
U.S. natural gas rig count and pipeline congestion in the U.S. Northeast. However, significantly higher prices will likely be limited by the ability of the power sector to use coal as a substitute for natural gas.
|
|
|
| Cenovus Energy Inc. First Quarter 2017 Report |
|
Page 41 Management’s
Discussion and Analysis |
Our exposure to the light/heavy price differentials is composed of both a global light/heavy component as
well as Canadian transportation constraints. While we expect to see volatility in crude oil prices, we have the ability to partially mitigate our exposure to light/heavy price differentials through the following:
| ● |
|
Integration – having heavy oil refining capacity capable of processing Canadian heavy oil. From a value perspective,
our refining business positions us to capture value from both the WTI-WCS differential for Canadian crude oil and the Brent-WTI differential from the sale of refined
products; |
| ● |
|
Financial hedge transactions – limiting the impact of fluctuations in upstream crude oil prices by entering into
financial transactions that fix the WTI-WCS differential; |
| ● |
|
Marketing arrangements – limiting the impact of fluctuations in upstream crude oil prices by entering into physical
supply transactions with fixed price components directly with refiners; and |
| ● |
|
Transportation commitments and arrangements – supporting transportation projects that move crude oil from our
production areas to consuming markets and also to tidewater markets. |
Additional natural gas and natural gas liquids production
associated with the Acquisition will provide improved upstream integration for the fuel, solvent and blending requirements at our oil sands operations.
Key Priorities for 2017
Maintain Financial Resilience and Transaction Execution
Maintaining our financial resilience, while maintaining safe operations, continues to be a top priority. We anticipate closing the Acquisition in the
second quarter of 2017. The safe and efficient integration of the Deep Basin assets will be a priority. We are committed to maintaining our financial resilience following the close of the Acquisition. Our first priority following completion of the
Acquisition will be to optimize our asset portfolio and capital structure, including a plan to repay the committed Bridge Facility.
Disciplined and Value-added Growth
We intend to update our 2017 capital investment guidance after the close of
the Acquisition. Based on our December 8, 2016 guidance, which does not reflect the Acquisition, we anticipated capital investment in 2017 to be between $1.2 billion and $1.4 billion. We planned to direct the majority of our 2017
capital budget towards sustaining oil sands production and base production at our other operations. A portion of our capital budget is planned for growth at our existing oil sands assets as well as at our tight oil assets in southern Alberta. With
integration remaining an important part of our overall strategy, capital investment is also allocated for scheduled maintenance and reliability work at the Refineries.
Sustainable Cost Improvements
In the past two years, we have achieved substantial improvements in our operating and sustaining capital costs through identifying efficiencies,
maximizing the strengths of our functional business model, and disciplined manufacturing. In 2017, we plan to continue to focus on making sustainable cost improvements across the organization. We anticipate maintaining lower costs while increasing
production and capital investment.
Market Access
Market access constraints for Canadian crude oil continue to be a challenge. In 2017, we plan to continue assessing a variety of options available to
market our growing oil sands production, including tidewater access.
|
|
|
| Cenovus Energy Inc. First Quarter 2017 Report |
|
Page 42 Management’s
Discussion and Analysis |
CONSOLIDATED STATEMENTS OF EARNINGS (LOSS) (unaudited)
For the periods ended March 31,
($ millions, except per share amounts)
|
|
|
|
|
|
|
|
|
|
|
|
|
|
|
|
|
| |
|
|
|
|
|
|
Three Months Ended |
|
| |
|
Notes |
|
|
|
|
2017 |
|
|
|
|
2016 |
|
|
|
|
|
|
|
| Revenues |
|
|
1 |
|
|
|
|
|
|
|
|
|
|
|
|
|
| Gross Sales |
|
|
|
|
|
|
|
|
3,942 |
|
|
|
|
|
2,265 |
|
| Less: Royalties |
|
|
|
|
|
|
|
|
77 |
|
|
|
|
|
20 |
|
|
|
|
|
|
|
|
|
|
3,865 |
|
|
|
|
|
2,245 |
|
| Expenses |
|
|
1 |
|
|
|
|
|
|
|
|
|
|
|
|
|
| Purchased Product |
|
|
|
|
|
|
|
|
2,234 |
|
|
|
|
|
1,362 |
|
| Transportation and Blending |
|
|
|
|
|
|
|
|
615 |
|
|
|
|
|
450 |
|
| Operating |
|
|
|
|
|
|
|
|
468 |
|
|
|
|
|
451 |
|
| Production and Mineral Taxes |
|
|
|
|
|
|
|
|
5 |
|
|
|
|
|
2 |
|
| (Gain) Loss on Risk Management |
|
|
20 |
|
|
|
|
|
(187 |
) |
|
|
|
|
(16 |
) |
| Depreciation, Depletion and Amortization |
|
|
6,12 |
|
|
|
|
|
363 |
|
|
|
|
|
542 |
|
| Exploration Expense |
|
|
6,11 |
|
|
|
|
|
3 |
|
|
|
|
|
1 |
|
| General and Administrative |
|
|
|
|
|
|
|
|
43 |
|
|
|
|
|
60 |
|
| Finance Costs |
|
|
4 |
|
|
|
|
|
120 |
|
|
|
|
|
124 |
|
| Interest Income |
|
|
|
|
|
|
|
|
(17 |
) |
|
|
|
|
(11 |
) |
| Foreign Exchange (Gain) Loss, Net |
|
|
5 |
|
|
|
|
|
(76 |
) |
|
|
|
|
(403 |
) |
| Transaction Costs |
|
|
|
|
|
|
|
|
29 |
|
|
|
|
|
- |
|
| Research Costs |
|
|
|
|
|
|
|
|
4 |
|
|
|
|
|
18 |
|
| (Gain) Loss on Divestiture of Assets |
|
|
|
|
|
|
|
|
1 |
|
|
|
|
|
- |
|
| Earnings (Loss) Before Income Tax |
|
|
|
|
|
|
|
|
260 |
|
|
|
|
|
(335 |
) |
| Income Tax Expense (Recovery) |
|
|
7 |
|
|
|
|
|
49 |
|
|
|
|
|
(217 |
) |
| Net Earnings (Loss) |
|
|
|
|
|
|
|
|
211 |
|
|
|
|
|
(118 |
) |
|
|
|
|
|
|
| Net Earnings (Loss) Per Share ($) |
|
|
8 |
|
|
|
|
|
|
|
|
|
|
|
|
|
| Basic and Diluted |
|
|
|
|
|
|
|
|
0.25 |
|
|
|
|
|
(0.14 |
) |
See accompanying Notes to Consolidated Financial Statements (unaudited).
CONSOLIDATED STATEMENTS OF COMPREHENSIVE INCOME (LOSS) (unaudited)
For the
periods ended March 31,
($ millions)
|
|
|
|
|
|
|
|
|
|
|
|
|
|
|
|
|
| |
|
|
|
|
|
|
Three Months Ended |
|
| |
|
Notes |
|
|
|
|
2017 |
|
|
|
|
2016 |
|
|
|
|
|
|
|
| Net Earnings (Loss) |
|
|
|
|
|
|
|
|
211 |
|
|
|
|
|
(118 |
) |
| Other Comprehensive Income (Loss), Net of Tax |
|
|
17 |
|
|
|
|
|
|
|
|
|
|
|
|
|
| Items That Will Not be Reclassified to Profit or Loss: |
|
|
|
|
|
|
|
|
|
|
|
|
|
|
|
|
| Actuarial Gain (Loss) Relating to Pension and Other Post-Retirement Benefits |
|
|
|
|
|
|
|
|
(3 |
) |
|
|
|
|
(4 |
) |
| Items That May be Reclassified to Profit or Loss: |
|
|
|
|
|
|
|
|
|
|
|
|
|
|
|
|
| Available for Sale Financial Assets – Change in Fair Value |
|
|
|
|
|
|
|
|
- |
|
|
|
|
|
(3 |
) |
| Foreign Currency Translation Adjustment |
|
|
|
|
|
|
|
|
(43 |
) |
|
|
|
|
(256 |
) |
| Total Other Comprehensive Income (Loss), Net of Tax |
|
|
|
|
|
|
|
|
(46 |
) |
|
|
|
|
(263 |
) |
| Comprehensive Income (Loss) |
|
|
|
|
|
|
|
|
165 |
|
|
|
|
|
(381 |
) |
See accompanying Notes to Consolidated Financial Statements (unaudited).
|
|
|
| Cenovus Energy Inc. First Quarter 2017 Report |
|
Page 43 Consolidated
Financial Statements |
CONSOLIDATED BALANCE SHEETS (unaudited)
As at
($ millions)
|
|
|
|
|
|
|
|
|
|
|
|
|
|
|
|
|
| |
|
Notes |
|
|
|
|
March 31,
2017 |
|
|
|
|
December 31,
2016 |
|
|
|
|
|
|
|
| Assets |
|
|
|
|
|
|
|
|
|
|
|
|
|
|
|
|
| Current Assets |
|
|
|
|
|
|
|
|
|
|
|
|
|
|
|
|
| Cash and Cash Equivalents |
|
|
|
|
|
|
|
|
3,548 |
|
|
|
|
|
3,720 |
|
| Accounts Receivable and Accrued Revenues |
|
|
|
|
|
|
|
|
1,749 |
|
|
|
|
|
1,838 |
|
| Income Tax Receivable |
|
|
|
|
|
|
|
|
20 |
|
|
|
|
|
6 |
|
| Inventories |
|
|
9 |
|
|
|
|
|
1,232 |
|
|
|
|
|
1,237 |
|
| Risk Management |
|
|
20,21 |
|
|
|
|
|
56 |
|
|
|
|
|
21 |
|
| Assets Held for Sale |
|
|
10 |
|
|
|
|
|
2,252 |
|
|
|
|
|
- |
|
| Total Current Assets |
|
|
|
|
|
|
|
|
8,857 |
|
|
|
|
|
6,822 |
|
| Exploration and Evaluation Assets |
|
|
1,11 |
|
|
|
|
|
1,369 |
|
|
|
|
|
1,585 |
|
| Property, Plant and Equipment, Net |
|
|
1,12 |
|
|
|
|
|
14,439 |
|
|
|
|
|
16,426 |
|
| Risk Management |
|
|
20,21 |
|
|
|
|
|
7 |
|
|
|
|
|
3 |
|
| Income Tax Receivable |
|
|
|
|
|
|
|
|
147 |
|
|
|
|
|
124 |
|
| Other Assets |
|
|
|
|
|
|
|
|
64 |
|
|
|
|
|
56 |
|
| Goodwill |
|
|
1 |
|
|
|
|
|
242 |
|
|
|
|
|
242 |
|
| Total Assets |
|
|
|
|
|
|
|
|
25,125 |
|
|
|
|
|
25,258 |
|
|
|
|
|
|
|
|
|
|
|
|
|
|
|
|
|
|
| Liabilities and Shareholders’ Equity |
|
|
|
|
|
|
|
|
|
|
|
|
|
|
|
|
| Current Liabilities |
|
|
|
|
|
|
|
|
|
|
|
|
|
|
|
|
| Accounts Payable and Accrued Liabilities |
|
|
|
|
|
|
|
|
2,072 |
|
|
|
|
|
2,266 |
|
| Income Tax Payable |
|
|
|
|
|
|
|
|
125 |
|
|
|
|
|
112 |
|
| Risk Management |
|
|
20,21 |
|
|
|
|
|
67 |
|
|
|
|
|
293 |
|
| Liabilities Related to Assets Held for Sale |
|
|
10 |
|
|
|
|
|
638 |
|
|
|
|
|
- |
|
| Total Current Liabilities |
|
|
|
|
|
|
|
|
2,902 |
|
|
|
|
|
2,671 |
|
| Long-Term Debt |
|
|
13 |
|
|
|
|
|
6,277 |
|
|
|
|
|
6,332 |
|
| Risk Management |
|
|
20,21 |
|
|
|
|
|
5 |
|
|
|
|
|
22 |
|
| Decommissioning Liabilities |
|
|
14 |
|
|
|
|
|
1,363 |
|
|
|
|
|
1,847 |
|
| Other Liabilities |
|
|
15 |
|
|
|
|
|
213 |
|
|
|
|
|
211 |
|
| Deferred Income Taxes |
|
|
|
|
|
|
|
|
2,648 |
|
|
|
|
|
2,585 |
|
| Total Liabilities |
|
|
|
|
|
|
|
|
13,408 |
|
|
|
|
|
13,668 |
|
| Shareholders’ Equity |
|
|
|
|
|
|
|
|
11,717 |
|
|
|
|
|
11,590 |
|
| Total Liabilities and Shareholders’ Equity |
|
|
|
|
|
|
|
|
25,125 |
|
|
|
|
|
25,258 |
|
|
|
|
|
|
|
|
|
|
|
|
|
|
|
|
|
|
See accompanying Notes to
Consolidated Financial Statements (unaudited).
|
|
|
| Cenovus Energy Inc. First Quarter 2017 Report |
|
Page 44 Consolidated
Financial Statements |
CONSOLIDATED STATEMENTS OF SHAREHOLDERS’ EQUITY (unaudited)
($ millions)
|
|
|
|
|
|
|
|
|
|
|
|
|
|
|
|
|
|
|
|
|
|
|
|
|
|
|
|
|
| |
|
Share
Capital |
|
|
|
|
Paid in
Surplus |
|
|
|
|
Retained
Earnings |
|
|
|
|
AOCI (1) |
|
|
|
|
Total |
|
|
|
|
(Note 16 |
) |
|
|
|
|
|
|
|
|
|
|
|
|
|
|
|
|
(Note 17 |
) |
|
|
|
|
|
|
|
|
|
|
|
|
|
|
|
|
| As at December 31, 2015 |
|
|
5,534 |
|
|
|
|
|
4,330 |
|
|
|
|
|
1,507 |
|
|
|
|
|
1,020 |
|
|
|
|
|
12,391 |
|
| Net Earnings (Loss) |
|
|
- |
|
|
|
|
|
- |
|
|
|
|
|
(118 |
) |
|
|
|
|
- |
|
|
|
|
|
(118 |
) |
| Other Comprehensive Income (Loss) |
|
|
- |
|
|
|
|
|
- |
|
|
|
|
|
- |
|
|
|
|
|
(263 |
) |
|
|
|
|
(263 |
) |
| Total Comprehensive Income (Loss) |
|
|
- |
|
|
|
|
|
- |
|
|
|
|
|
(118 |
) |
|
|
|
|
(263 |
) |
|
|
|
|
(381 |
) |
| Stock-Based Compensation Expense |
|
|
- |
|
|
|
|
|
5 |
|
|
|
|
|
- |
|
|
|
|
|
- |
|
|
|
|
|
5 |
|
| Dividends on Common Shares |
|
|
- |
|
|
|
|
|
- |
|
|
|
|
|
(41 |
) |
|
|
|
|
- |
|
|
|
|
|
(41 |
) |
| As at March 31, 2016 |
|
|
5,534 |
|
|
|
|
|
4,335 |
|
|
|
|
|
1,348 |
|
|
|
|
|
757 |
|
|
|
|
|
11,974 |
|
|
|
|
|
|
|
|
|
|
|
|
|
|
|
|
|
|
|
|
|
|
|
|
|
|
|
|
|
|
| As at December 31, 2016 |
|
|
5,534 |
|
|
|
|
|
4,350 |
|
|
|
|
|
796 |
|
|
|
|
|
910 |
|
|
|
|
|
11,590 |
|
| Net Earnings (Loss) |
|
|
- |
|
|
|
|
|
- |
|
|
|
|
|
211 |
|
|
|
|
|
- |
|
|
|
|
|
211 |
|
| Other Comprehensive Income (Loss) |
|
|
- |
|
|
|
|
|
- |
|
|
|
|
|
- |
|
|
|
|
|
(46 |
) |
|
|
|
|
(46 |
) |
| Total Comprehensive Income (Loss) |
|
|
- |
|
|
|
|
|
- |
|
|
|
|
|
211 |
|
|
|
|
|
(46 |
) |
|
|
|
|
165 |
|
| Stock-Based Compensation Expense |
|
|
- |
|
|
|
|
|
3 |
|
|
|
|
|
- |
|
|
|
|
|
- |
|
|
|
|
|
3 |
|
| Dividends on Common Shares |
|
|
- |
|
|
|
|
|
- |
|
|
|
|
|
(41 |
) |
|
|
|
|
- |
|
|
|
|
|
(41 |
) |
| As at March 31, 2017 |
|
|
5,534 |
|
|
|
|
|
4,353 |
|
|
|
|
|
966 |
|
|
|
|
|
864 |
|
|
|
|
|
11,717 |
|
| (1) |
Accumulated Other Comprehensive Income (Loss). |
See accompanying Notes to Consolidated Financial Statements
(unaudited).
|
|
|
| Cenovus Energy Inc. First Quarter 2017 Report |
|
Page 45 Consolidated
Financial Statements |
CONSOLIDATED STATEMENTS OF CASH FLOWS (unaudited)
For the periods ended March 31,
($ millions)
|
|
|
|
|
|
|
|
|
|
|
|
|
|
|
|
|
| |
|
|
|
|
|
|
Three Months Ended |
|
| |
|
Notes |
|
|
|
|
2017 |
|
|
|
|
2016 |
|
|
|
|
|
|
|
| Operating Activities |
|
|
|
|
|
|
|
|
|
|
|
|
|
|
|
|
| Net Earnings (Loss) |
|
|
|
|
|
|
|
|
211 |
|
|
|
|
|
(118 |
) |
| Depreciation, Depletion and Amortization |
|
|
6,12 |
|
|
|
|
|
363 |
|
|
|
|
|
542 |
|
| Exploration Expense |
|
|
|
|
|
|
|
|
3 |
|
|
|
|
|
1 |
|
| Deferred Income Taxes |
|
|
7 |
|
|
|
|
|
71 |
|
|
|
|
|
(190 |
) |
| Unrealized (Gain) Loss on Risk Management |
|
|
20 |
|
|
|
|
|
(279 |
) |
|
|
|
|
149 |
|
| Unrealized Foreign Exchange (Gain) Loss |
|
|
5 |
|
|
|
|
|
(72 |
) |
|
|
|
|
(409 |
) |
| (Gain) Loss on Divestiture of Assets |
|
|
|
|
|
|
|
|
1 |
|
|
|
|
|
- |
|
| Unwinding of Discount on Decommissioning Liabilities |
|
|
4,14 |
|
|
|
|
|
26 |
|
|
|
|
|
32 |
|
| Onerous Contract Provisions, Net of Cash Paid |
|
|
|
|
|
|
|
|
3 |
|
|
|
|
|
14 |
|
| Other |
|
|
|
|
|
|
|
|
(4 |
) |
|
|
|
|
5 |
|
| Net Change in Other Assets and Liabilities |
|
|
|
|
|
|
|
|
(31 |
) |
|
|
|
|
(29 |
) |
| Net Change in Non-Cash Working Capital |
|
|
|
|
|
|
|
|
36 |
|
|
|
|
|
185 |
|
| Cash From Operating Activities |
|
|
|
|
|
|
|
|
328 |
|
|
|
|
|
182 |
|
|
|
|
|
|
|
|
|
|
|
|
|
|
|
|
|
|
| Investing Activities |
|
|
|
|
|
|
|
|
|
|
|
|
|
|
|
|
| Capital Expenditures – Exploration and Evaluation Assets |
|
|
11 |
|
|
|
|
|
(43 |
) |
|
|
|
|
(34 |
) |
| Capital Expenditures – Property, Plant and Equipment |
|
|
12 |
|
|
|
|
|
(270 |
) |
|
|
|
|
(289 |
) |
| Acquisition Deposit |
|
|
24 |
|
|
|
|
|
(173 |
) |
|
|
|
|
- |
|
| Net Change in Investments and Other |
|
|
|
|
|
|
|
|
- |
|
|
|
|
|
1 |
|
| Net Change in Non-Cash Working Capital |
|
|
|
|
|
|
|
|
27 |
|
|
|
|
|
(47 |
) |
| Cash From (Used in) Investing Activities |
|
|
|
|
|
|
|
|
(459 |
) |
|
|
|
|
(369 |
) |
|
|
|
|
|
|
|
|
|
|
|
|
|
|
|
|
|
| Net Cash Provided (Used) Before Financing Activities |
|
|
|
|
|
|
|
|
(131 |
) |
|
|
|
|
(187 |
) |
|
|
|
|
|
|
|
|
|
|
|
|
|
|
|
|
|
| Financing Activities |
|
|
22 |
|
|
|
|
|
|
|
|
|
|
|
|
|
| Dividends Paid on Common Shares |
|
|
8 |
|
|
|
|
|
(41 |
) |
|
|
|
|
(41 |
) |
| Acquisition Financing Costs |
|
|
|
|
|
|
|
|
(10 |
) |
|
|
|
|
- |
|
| Other |
|
|
|
|
|
|
|
|
(1 |
) |
|
|
|
|
- |
|
| Cash From (Used in) Financing Activities |
|
|
|
|
|
|
|
|
(52 |
) |
|
|
|
|
(41 |
) |
|
|
|
|
|
|
|
|
|
|
|
|
|
|
|
|
|
| Foreign Exchange Gain (Loss) on Cash and Cash
Equivalents Held in Foreign Currency |
|
|
|
|
|
|
|
|
11 |
|
|
|
|
|
6 |
|
| Increase (Decrease) in Cash and Cash Equivalents |
|
|
|
|
|
|
|
|
(172 |
) |
|
|
|
|
(222 |
) |
| Cash and Cash Equivalents, Beginning of Period |
|
|
|
|
|
|
|
|
3,720 |
|
|
|
|
|
4,105 |
|
| Cash and Cash Equivalents, End of Period |
|
|
|
|
|
|
|
|
3,548 |
|
|
|
|
|
3,883 |
|
|
|
|
|
|
|
|
|
|
|
|
|
|
|
|
|
|
See accompanying Notes to
Consolidated Financial Statements (unaudited).
|
|
|
| Cenovus Energy Inc. First Quarter 2017 Report |
|
Page 46 Consolidated
Financial Statements |
NOTES TO CONSOLIDATED FINANCIAL STATEMENTS (unaudited)
All amounts in $ millions, unless otherwise indicated
For the period ended March 31, 2017
1.
DESCRIPTION OF BUSINESS AND SEGMENTED DISCLOSURES
Cenovus Energy Inc. and its subsidiaries, (together “Cenovus” or the “Company”) are in the business of developing, producing and
marketing crude oil, natural gas liquids (“NGLs”) and natural gas in Canada with marketing activities and refining operations in the United States (“U.S.”).
Cenovus is incorporated under the Canada Business Corporations Act and its shares are listed on the Toronto (“TSX”) and New York
(“NYSE”) stock exchanges. The executive and registered office is located at 2600, 500 Centre Street S.E., Calgary, Alberta, Canada, T2G 1A6. Information on the Company’s basis of preparation for these interim Consolidated
Financial Statements is found in Note 2.
On March 29, 2017, Cenovus entered into a purchase and sale agreement with ConocoPhillips Company and
certain of its subsidiaries (collectively, “ConocoPhillips”) to acquire ConocoPhillips’ 50 percent interest in FCCL Partnership (“FCCL”) and the majority of ConocoPhillips’ western Canadian conventional crude oil
and natural gas assets (the “Deep Basin Assets”). This transformational acquisition will increase Cenovus’s interest in FCCL to 100 percent and expand Cenovus’s operating areas to include undeveloped land, exploration
and production assets and related infrastructure and agreements in Alberta and into British Columbia. The acquisition is expected to close in the second quarter of 2017 (see Note 24 – Subsequent Event).
Management has determined the operating segments based on information regularly reviewed for the purposes of decision making, allocating resources and
assessing operational performance by Cenovus’s chief operating decision makers. The Company evaluates the financial performance of its operating segments primarily based on operating margin. The Company’s reportable segments are:
| |
• |
|
Oil Sands, which includes the development and production of bitumen and natural gas in northeast Alberta.
Cenovus’s bitumen assets include Foster Creek, Christina Lake and Narrows Lake as well as projects in the early stages of development, such as Telephone Lake. Certain of the Company’s operated oil sands properties, notably Foster Creek,
Christina Lake and Narrows Lake, are jointly owned with ConocoPhillips, an unrelated U.S. public company. |
| |
• |
|
Conventional, which includes the development and production of conventional crude oil, NGLs and natural gas in
Alberta and Saskatchewan, including the heavy oil assets at Pelican Lake, the carbon dioxide enhanced oil recovery project at Weyburn and emerging tight oil opportunities. |
| |
• |
|
Refining and Marketing, which is responsible for transporting, selling and refining crude oil into petroleum and
chemical products. Cenovus jointly owns two refineries in the U.S. with the operator Phillips 66, an unrelated U.S. public company. In addition, Cenovus owns and operates a
crude-by-rail terminal in Alberta. This segment coordinates Cenovus’s marketing and transportation initiatives to optimize product mix, delivery points,
transportation commitments and customer diversification. The marketing of crude oil and natural gas sourced from Canada, including physical product sales that settle in the U.S., is considered to be undertaken by a Canadian business. U.S. sourced
crude oil and natural gas purchases and sales are attributed to the U.S. |
| |
• |
|
Corporate and Eliminations, which primarily includes unrealized gains and losses recorded on derivative financial
instruments, gains and losses on divestiture of assets, as well as other Cenovus-wide costs for general and administrative, financing activities and research costs. As financial instruments are settled, the realized gains and losses are recorded in
the reportable segment to which the derivative instrument relates. Eliminations relate to sales and operating revenues, and purchased product between segments, recorded at transfer prices based on current market prices, and to unrealized
intersegment profits in inventory. The Corporate and Eliminations segment is attributed to Canada, with the exception of unrealized risk management gains and losses, which have been attributed to the country in which the transacting entity resides.
|
The following tabular financial information presents the segmented information first by segment, then by product and geographic
location.
|
|
|
| Cenovus Energy Inc. First Quarter 2017 Report |
|
Page 47 Notes to
Consolidated Financial Statements |
NOTES TO CONSOLIDATED FINANCIAL STATEMENTS (unaudited)
All amounts in $ millions, unless otherwise indicated
For the period ended March 31, 2017
A) Results of Operations – Segment and Operational Information
|
|
|
|
|
|
|
|
|
|
|
|
|
|
|
|
|
|
|
|
|
|
|
| |
|
Oil Sands |
|
|
|
Conventional |
|
|
|
Refining and Marketing |
| For the three months ended March 31, |
|
2017 |
|
|
|
2016 |
|
|
|
2017 |
|
|
|
2016 |
|
|
|
2017 |
|
|
|
2016 |
|
|
|
|
|
|
|
|
|
|
|
|
| Revenues |
|
|
|
|
|
|
|
|
|
|
|
|
|
|
|
|
|
|
|
|
|
|
| Gross Sales |
|
1,062 |
|
|
|
470 |
|
|
|
374 |
|
|
|
274 |
|
|
|
2,604 |
|
|
|
1,588 |
| Less: Royalties |
|
27 |
|
|
|
- |
|
|
|
50 |
|
|
|
20 |
|
|
|
- |
|
|
|
- |
|
|
1,035 |
|
|
|
470 |
|
|
|
324 |
|
|
|
254 |
|
|
|
2,604 |
|
|
|
1,588 |
| Expenses |
|
|
|
|
|
|
|
|
|
|
|
|
|
|
|
|
|
|
|
|
|
|
| Purchased Product |
|
- |
|
|
|
- |
|
|
|
- |
|
|
|
- |
|
|
|
2,330 |
|
|
|
1,428 |
| Transportation and Blending |
|
566 |
|
|
|
404 |
|
|
|
51 |
|
|
|
47 |
|
|
|
- |
|
|
|
- |
| Operating |
|
140 |
|
|
|
127 |
|
|
|
110 |
|
|
|
122 |
|
|
|
219 |
|
|
|
203 |
| Production and Mineral Taxes |
|
- |
|
|
|
- |
|
|
|
5 |
|
|
|
2 |
|
|
|
- |
|
|
|
- |
| (Gain) Loss on Risk Management |
|
77 |
|
|
|
(106) |
|
|
|
13 |
|
|
|
(39) |
|
|
|
2 |
|
|
|
(20) |
| Operating Margin |
|
252 |
|
|
|
45 |
|
|
|
145 |
|
|
|
122 |
|
|
|
53 |
|
|
|
(23) |
| Depreciation, Depletion and Amortization |
|
170 |
|
|
|
148 |
|
|
|
121 |
|
|
|
322 |
|
|
|
54 |
|
|
|
55 |
| Exploration Expense |
|
- |
|
|
|
1 |
|
|
|
3 |
|
|
|
- |
|
|
|
- |
|
|
|
- |
| Segment Income (Loss) |
|
82 |
|
|
|
(104) |
|
|
|
21 |
|
|
|
(200) |
|
|
|
(1) |
|
|
|
(78) |
|
|
|
|
|
|
|
|
| |
|
|
|
|
|
|
|
|
|
Corporate and Eliminations |
|
|
|
Consolidated |
| For the three months ended March 31, |
|
|
|
|
|
|
|
|
|
2017 |
|
|
|
2016 |
|
|
|
2017 |
|
|
|
2016 |
|
|
|
|
|
|
|
|
|
|
|
|
| Revenues |
|
|
|
|
|
|
|
|
|
|
|
|
|
|
|
|
|
|
|
|
|
|
| Gross Sales |
|
|
|
|
|
|
|
|
|
(98) |
|
|
|
(67) |
|
|
|
3,942 |
|
|
|
2,265 |
| Less: Royalties |
|
|
|
|
|
|
|
|
|
- |
|
|
|
- |
|
|
|
77 |
|
|
|
20 |
|
|
|
|
|
|
|
|
|
|
(98) |
|
|
|
(67) |
|
|
|
3,865 |
|
|
|
2,245 |
|
|
|
|
|
|
|
|
|
|
|
|
| Expenses |
|
|
|
|
|
|
|
|
|
|
|
|
|
|
|
|
|
|
|
|
|
|
| Purchased Product |
|
|
|
|
|
|
|
|
|
(96) |
|
|
|
(66) |
|
|
|
2,234 |
|
|
|
1,362 |
| Transportation and Blending |
|
|
|
|
|
|
|
|
|
(2) |
|
|
|
(1) |
|
|
|
615 |
|
|
|
450 |
| Operating |
|
|
|
|
|
|
|
|
|
(1) |
|
|
|
(1) |
|
|
|
468 |
|
|
|
451 |
| Production and Mineral Taxes |
|
|
|
|
|
|
|
|
|
- |
|
|
|
- |
|
|
|
5 |
|
|
|
2 |
| (Gain) Loss on Risk Management |
|
|
|
|
|
|
|
|
|
(279) |
|
|
|
149 |
|
|
|
(187) |
|
|
|
(16) |
| Depreciation, Depletion and Amortization |
|
|
|
|
|
|
|
|
|
18 |
|
|
|
17 |
|
|
|
363 |
|
|
|
542 |
| Exploration Expense |
|
|
|
|
|
|
|
|
|
- |
|
|
|
- |
|
|
|
3 |
|
|
|
1 |
| Segment Income (Loss) |
|
|
|
|
|
|
|
|
|
262 |
|
|
|
(165) |
|
|
|
364 |
|
|
|
(547) |
| General and Administrative |
|
|
|
|
|
|
|
|
|
43 |
|
|
|
60 |
|
|
|
43 |
|
|
|
60 |
| Finance Costs |
|
|
|
|
|
|
|
|
|
120 |
|
|
|
124 |
|
|
|
120 |
|
|
|
124 |
| Interest Income |
|
|
|
|
|
|
|
|
|
(17) |
|
|
|
(11) |
|
|
|
(17) |
|
|
|
(11) |
| Foreign Exchange (Gain) Loss, Net |
|
|
|
|
|
|
|
|
|
(76) |
|
|
|
(403) |
|
|
|
(76) |
|
|
|
(403) |
| Transaction Costs |
|
|
|
|
|
|
|
|
|
29 |
|
|
|
- |
|
|
|
29 |
|
|
|
- |
| Research Costs |
|
|
|
|
|
|
|
|
|
4 |
|
|
|
18 |
|
|
|
4 |
|
|
|
18 |
| (Gain) Loss on Divestiture of Assets |
|
|
|
|
|
|
|
|
|
1 |
|
|
|
- |
|
|
|
1 |
|
|
|
- |
|
|
|
|
|
|
|
|
|
|
104 |
|
|
|
(212) |
|
|
|
104 |
|
|
|
(212) |
| Earnings (Loss) Before Income Tax |
|
|
|
|
|
|
|
|
|
|
|
|
|
|
|
|
|
260 |
|
|
|
(335) |
| Income Tax Expense (Recovery) |
|
|
|
|
|
|
|
|
|
|
|
|
|
|
|
|
|
49 |
|
|
|
(217) |
| Net Earnings (Loss) |
|
|
|
|
|
|
|
|
|
|
|
|
|
|
|
|
|
211 |
|
|
|
(118) |
|
|
|
| Cenovus Energy Inc. First Quarter 2017 Report |
|
Page 48 Notes to
Consolidated Financial Statements |
NOTES TO CONSOLIDATED FINANCIAL STATEMENTS (unaudited)
All amounts in $ millions, unless otherwise indicated
For the period ended March 31, 2017
B) Financial Results by Upstream Product
|
|
|
|
|
|
|
|
|
|
|
|
|
|
|
|
|
|
|
|
|
|
|
|
|
|
|
|
|
|
|
| |
|
Crude Oil (1) |
| |
|
Oil Sands |
|
|
|
|
Conventional |
|
|
|
|
Total |
| For the three months ended March 31, |
|
2017 |
|
|
|
2016 |
|
|
|
|
2017 |
|
|
|
|
2016 |
|
|
|
|
2017 |
|
|
|
|
2016 |
|
|
|
|
|
|
|
|
|
|
|
|
| Revenues |
|
|
|
|
|
|
|
|
|
|
|
|
|
|
|
|
|
|
|
|
|
|
|
|
|
|
|
|
|
|
| Gross Sales |
|
1,055 |
|
|
|
465 |
|
|
|
|
|
279 |
|
|
|
|
|
189 |
|
|
|
|
|
1,334 |
|
|
|
|
|
654 |
| Less: Royalties |
|
27 |
|
|
|
- |
|
|
|
|
|
46 |
|
|
|
|
|
17 |
|
|
|
|
|
73 |
|
|
|
|
|
17 |
|
|
1,028 |
|
|
|
465 |
|
|
|
|
|
233 |
|
|
|
|
|
172 |
|
|
|
|
|
1,261 |
|
|
|
|
|
637 |
| Expenses |
|
|
|
|
|
|
|
|
|
|
|
|
|
|
|
|
|
|
|
|
|
|
|
|
|
|
|
|
|
|
| Transportation and Blending |
|
566 |
|
|
|
404 |
|
|
|
|
|
47 |
|
|
|
|
|
44 |
|
|
|
|
|
613 |
|
|
|
|
|
448 |
| Operating |
|
136 |
|
|
|
122 |
|
|
|
|
|
69 |
|
|
|
|
|
78 |
|
|
|
|
|
205 |
|
|
|
|
|
200 |
| Production and Mineral Taxes |
|
- |
|
|
|
- |
|
|
|
|
|
4 |
|
|
|
|
|
2 |
|
|
|
|
|
4 |
|
|
|
|
|
2 |
| (Gain) Loss on Risk Management |
|
77 |
|
|
|
(106) |
|
|
|
|
|
13 |
|
|
|
|
|
(40) |
|
|
|
|
|
90 |
|
|
|
|
|
(146) |
| Operating Margin |
|
249 |
|
|
|
45 |
|
|
|
|
|
100 |
|
|
|
|
|
88 |
|
|
|
|
|
349 |
|
|
|
|
|
133 |
|
(1) Includes NGLs. |
|
|
| |
|
Natural Gas |
| |
|
Oil Sands |
|
|
|
|
Conventional |
|
|
|
|
Total |
| For the three months ended March 31, |
|
2017 |
|
|
|
2016 |
|
|
|
|
2017 |
|
|
|
|
2016 |
|
|
|
|
2017 |
|
|
|
|
2016 |
|
|
|
|
|
|
|
|
|
|
|
|
| Revenues |
|
|
|
|
|
|
|
|
|
|
|
|
|
|
|
|
|
|
|
|
|
|
|
|
|
|
|
|
|
|
| Gross Sales |
|
4 |
|
|
|
4 |
|
|
|
|
|
94 |
|
|
|
|
|
82 |
|
|
|
|
|
98 |
|
|
|
|
|
86 |
| Less: Royalties |
|
- |
|
|
|
- |
|
|
|
|
|
4 |
|
|
|
|
|
3 |
|
|
|
|
|
4 |
|
|
|
|
|
3 |
|
|
4 |
|
|
|
4 |
|
|
|
|
|
90 |
|
|
|
|
|
79 |
|
|
|
|
|
94 |
|
|
|
|
|
83 |
| Expenses |
|
|
|
|
|
|
|
|
|
|
|
|
|
|
|
|
|
|
|
|
|
|
|
|
|
|
|
|
|
|
| Transportation and Blending |
|
- |
|
|
|
- |
|
|
|
|
|
4 |
|
|
|
|
|
3 |
|
|
|
|
|
4 |
|
|
|
|
|
3 |
| Operating |
|
3 |
|
|
|
3 |
|
|
|
|
|
41 |
|
|
|
|
|
42 |
|
|
|
|
|
44 |
|
|
|
|
|
45 |
| Production and Mineral Taxes |
|
- |
|
|
|
- |
|
|
|
|
|
1 |
|
|
|
|
|
- |
|
|
|
|
|
1 |
|
|
|
|
|
- |
| (Gain) Loss on Risk Management |
|
- |
|
|
|
- |
|
|
|
|
|
- |
|
|
|
|
|
1 |
|
|
|
|
|
- |
|
|
|
|
|
1 |
| Operating Margin |
|
1 |
|
|
|
1 |
|
|
|
|
|
44 |
|
|
|
|
|
33 |
|
|
|
|
|
45 |
|
|
|
|
|
34 |
|
|
| |
|
Other |
| |
|
Oil Sands |
|
|
|
|
Conventional |
|
|
|
|
Total |
| For the three months ended March 31, |
|
2017 |
|
|
|
2016 |
|
|
|
|
2017 |
|
|
|
|
2016 |
|
|
|
|
2017 |
|
|
|
|
2016 |
|
|
|
|
|
|
|
|
|
|
|
|
| Revenues |
|
|
|
|
|
|
|
|
|
|
|
|
|
|
|
|
|
|
|
|
|
|
|
|
|
|
|
|
|
|
| Gross Sales |
|
3 |
|
|
|
1 |
|
|
|
|
|
1 |
|
|
|
|
|
3 |
|
|
|
|
|
4 |
|
|
|
|
|
4 |
| Less: Royalties |
|
- |
|
|
|
- |
|
|
|
|
|
- |
|
|
|
|
|
- |
|
|
|
|
|
- |
|
|
|
|
|
- |
|
|
3 |
|
|
|
1 |
|
|
|
|
|
1 |
|
|
|
|
|
3 |
|
|
|
|
|
4 |
|
|
|
|
|
4 |
| Expenses |
|
|
|
|
|
|
|
|
|
|
|
|
|
|
|
|
|
|
|
|
|
|
|
|
|
|
|
|
|
|
| Transportation and Blending |
|
- |
|
|
|
- |
|
|
|
|
|
- |
|
|
|
|
|
- |
|
|
|
|
|
- |
|
|
|
|
|
- |
| Operating |
|
1 |
|
|
|
2 |
|
|
|
|
|
- |
|
|
|
|
|
2 |
|
|
|
|
|
1 |
|
|
|
|
|
4 |
| Production and Mineral Taxes |
|
- |
|
|
|
- |
|
|
|
|
|
- |
|
|
|
|
|
- |
|
|
|
|
|
- |
|
|
|
|
|
- |
| (Gain) Loss on Risk Management |
|
- |
|
|
|
- |
|
|
|
|
|
- |
|
|
|
|
|
- |
|
|
|
|
|
- |
|
|
|
|
|
- |
| Operating Margin |
|
2 |
|
|
|
(1) |
|
|
|
|
|
1 |
|
|
|
|
|
1 |
|
|
|
|
|
3 |
|
|
|
|
|
- |
|
|
| |
|
Total Upstream |
| |
|
Oil Sands |
|
|
|
|
Conventional |
|
|
|
|
Total |
| For the three months ended March 31, |
|
2017 |
|
|
|
2016 |
|
|
|
|
2017 |
|
|
|
|
2016 |
|
|
|
|
2017 |
|
|
|
|
2016 |
|
|
|
|
|
|
|
|
|
|
|
|
| Revenues |
|
|
|
|
|
|
|
|
|
|
|
|
|
|
|
|
|
|
|
|
|
|
|
|
|
|
|
|
|
|
| Gross Sales |
|
1,062 |
|
|
|
470 |
|
|
|
|
|
374 |
|
|
|
|
|
274 |
|
|
|
|
|
1,436 |
|
|
|
|
|
744 |
| Less: Royalties |
|
27 |
|
|
|
- |
|
|
|
|
|
50 |
|
|
|
|
|
20 |
|
|
|
|
|
77 |
|
|
|
|
|
20 |
|
|
1,035 |
|
|
|
470 |
|
|
|
|
|
324 |
|
|
|
|
|
254 |
|
|
|
|
|
1,359 |
|
|
|
|
|
724 |
|
|
|
|
|
|
|
|
|
|
|
|
| Expenses |
|
|
|
|
|
|
|
|
|
|
|
|
|
|
|
|
|
|
|
|
|
|
|
|
|
|
|
|
|
|
| Transportation and Blending |
|
566 |
|
|
|
404 |
|
|
|
|
|
51 |
|
|
|
|
|
47 |
|
|
|
|
|
617 |
|
|
|
|
|
451 |
| Operating |
|
140 |
|
|
|
127 |
|
|
|
|
|
110 |
|
|
|
|
|
122 |
|
|
|
|
|
250 |
|
|
|
|
|
249 |
| Production and Mineral Taxes |
|
- |
|
|
|
- |
|
|
|
|
|
5 |
|
|
|
|
|
2 |
|
|
|
|
|
5 |
|
|
|
|
|
2 |
| (Gain) Loss on Risk Management |
|
77 |
|
|
|
(106) |
|
|
|
|
|
13 |
|
|
|
|
|
(39) |
|
|
|
|
|
90 |
|
|
|
|
|
(145) |
| Operating Margin |
|
252 |
|
|
|
45 |
|
|
|
|
|
145 |
|
|
|
|
|
122 |
|
|
|
|
|
397 |
|
|
|
|
|
167 |
|
|
|
| Cenovus Energy Inc. First Quarter 2017 Report |
|
Page 49 Notes to
Consolidated Financial Statements |
NOTES TO CONSOLIDATED FINANCIAL STATEMENTS (unaudited)
All amounts in $ millions, unless otherwise indicated
For the period ended March 31, 2017
C) Exploration and Evaluation Assets, Property, Plant and Equipment, Goodwill and Total Assets
|
|
|
|
|
|
|
|
|
|
|
|
|
|
|
| |
|
E&E (1) |
|
|
|
PP&E (2) |
| |
|
March 31, |
|
|
|
December 31, |
|
|
|
March 31, |
|
|
|
December 31, |
| As at |
|
2017 |
|
|
|
2016 |
|
|
|
2017 |
|
|
|
2016 |
|
|
|
|
|
|
|
|
| Oil Sands |
|
1,350 |
|
|
|
1,564 |
|
|
|
8,694 |
|
|
|
8,798 |
| Conventional |
|
19 |
|
|
|
21 |
|
|
|
1,249 |
|
|
|
3,080 |
| Refining and Marketing |
|
- |
|
|
|
- |
|
|
|
4,231 |
|
|
|
4,273 |
| Corporate and Eliminations |
|
- |
|
|
|
- |
|
|
|
265 |
|
|
|
275 |
| Consolidated |
|
1,369 |
|
|
|
1,585 |
|
|
|
14,439 |
|
|
|
16,426 |
|
|
|
|
| |
|
Goodwill |
|
|
|
Total Assets |
| |
|
March 31, |
|
|
|
December 31, |
|
|
|
March 31, |
|
|
|
December 31, |
| As at |
|
2017 |
|
|
|
2016 |
|
|
|
2017 |
|
|
|
2016 |
|
|
|
|
|
|
|
|
| Oil Sands |
|
242 |
|
|
|
242 |
|
|
|
11,468 |
|
|
|
11,112 |
| Conventional |
|
- |
|
|
|
- |
|
|
|
3,268 |
|
|
|
3,196 |
| Refining and Marketing |
|
- |
|
|
|
- |
|
|
|
6,080 |
|
|
|
6,613 |
| Corporate and Eliminations |
|
- |
|
|
|
- |
|
|
|
4,309 |
|
|
|
4,337 |
| Consolidated |
|
242 |
|
|
|
242 |
|
|
|
25,125 |
|
|
|
25,258 |
| (1) |
Exploration and Evaluation (“E&E”) assets. |
| (2) |
Property, Plant and Equipment (“PP&E”). |
D) Geographical Information
|
|
|
|
|
|
|
| |
|
Revenues |
| |
|
Three Months Ended |
| For the periods ended March 31, |
|
2017 |
|
|
|
2016 |
|
|
|
|
| Canada |
|
2,183 |
|
|
|
1,114 |
| United States |
|
1,682 |
|
|
|
1,131 |
| Consolidated |
|
3,865 |
|
|
|
2,245 |
|
|
| |
|
Non-Current Assets (1) |
| |
|
March 31, |
|
|
|
December 31, |
| As at |
|
2017 |
|
|
|
2016 |
|
|
|
|
| Canada |
|
11,975 |
|
|
|
14,130 |
| United States |
|
4,139 |
|
|
|
4,179 |
| Consolidated |
|
16,114 |
|
|
|
18,309 |
|
(1) Includes E&E assets, PP&E, goodwill and other assets.
E) Capital Expenditures (1)
|
| |
|
Three Months Ended |
| For the periods ended March 31, |
|
2017 |
|
|
|
2016 |
|
|
|
|
| Capital |
|
|
|
|
|
|
| Oil Sands |
|
172 |
|
|
|
227 |
| Conventional |
|
88 |
|
|
|
39 |
| Refining and Marketing |
|
46 |
|
|
|
52 |
| Corporate |
|
7 |
|
|
|
5 |
| Capital Investment |
|
313 |
|
|
|
323 |
| (1) |
Includes expenditures on PP&E, E&E assets and Assets Held for Sale. |
|
|
|
| Cenovus Energy Inc. First Quarter 2017 Report |
|
Page 50 Notes to
Consolidated Financial Statements |
NOTES TO CONSOLIDATED FINANCIAL STATEMENTS (unaudited)
All amounts in $ millions, unless otherwise indicated
For the period ended March 31, 2017
2. BASIS OF PREPARATION AND STATEMENT OF COMPLIANCE
In these interim Consolidated Financial
Statements, unless otherwise indicated, all dollars are expressed in Canadian dollars. All references to C$ or $ are to Canadian dollars and references to US$ are to U.S. dollars.
These interim Consolidated Financial Statements have been prepared in accordance with International Financial Reporting Standards (“IFRS”) as
issued by the International Accounting Standards Board (“IASB”) applicable to the preparation of interim financial statements, including International Accounting Standard 34, “Interim Financial Reporting” (“IAS
34”), and have been prepared following the same accounting policies and methods of computation as the annual Consolidated Financial Statements for the year ended December 31, 2016, except for income taxes. Income taxes on earnings or loss
in the interim periods are accrued using the income tax rate that would be applicable to the expected total annual earnings or loss. Certain information and disclosures normally included in the notes to the annual Consolidated Financial Statements
have been condensed or have been disclosed on an annual basis only. Accordingly, these interim Consolidated Financial Statements should be read in conjunction with the annual Consolidated Financial Statements for the year ended December 31,
2016, which have been prepared in accordance with IFRS as issued by the IASB.
Certain information provided for the prior year has been reclassified
to conform to the presentation adopted for the year ended December 31, 2016.
These interim Consolidated Financial Statements were approved by
the Audit Committee effective April 25, 2017.
3. RECENT ACCOUNTING PRONOUNCEMENTS
New Accounting Standards and
Interpretations not yet Adopted
A number of new accounting standards, amendments to accounting standards and interpretations are
effective for annual periods beginning on or after January 1, 2017 and have not been applied in preparing the Consolidated Financial Statements for the period ended March 31, 2017. The following provides an update to the disclosure in the
annual Consolidated Financial Statements for the year ended December 31, 2016.
Revenue Recognition
On May 28, 2014, the IASB issued IFRS 15, “Revenue From Contracts With Customers” (“IFRS 15”) replacing IAS 11,
“Construction Contracts”, IAS 18, “Revenue” and several revenue-related interpretations. IFRS 15 establishes a single revenue recognition framework that applies to contracts with customers. The standard requires an
entity to recognize revenue to reflect the transfer of goods and services for the amount it expects to receive, when control is transferred to the purchaser. Disclosure requirements have also been expanded.
IFRS 15 is effective for annual periods beginning on or after January 1, 2018. The standard may be applied retrospectively or using a modified
retrospective approach. The Company is currently evaluating the impact of adopting IFRS 15 on the Consolidated Financial Statements and plans to adopt the standard for its year ended December 31, 2018.
Leases
On
January 13, 2016, the IASB issued IFRS 16, “Leases” (“IFRS 16”), which requires entities to recognize lease assets and lease obligations on the balance sheet. For lessees, IFRS 16 removes the classification of leases
as either operating leases or finance leases, effectively treating all leases as finance leases. Certain short-term leases (less than 12 months) and leases of low-value assets are exempt from the requirements,
and may continue to be treated as operating leases.
Lessors will continue with a dual lease classification model. Classification will determine how
and when a lessor will recognize lease revenue, and what assets would be recorded.
IFRS 16 is effective for years beginning on or after
January 1, 2019, with early adoption permitted if IFRS 15 has been adopted. The standard may be applied retrospectively or using a modified retrospective approach. The modified retrospective approach does not require restatement of prior period
financial information as it recognizes the cumulative effect as an adjustment to opening retained earnings and applies the standard prospectively.
The Company plans to apply IFRS 16 on January 1, 2019. A transition team is assessing the impacts of adopting IFRS 16 and will oversee changes to
accounting systems, processes and internal controls. The estimated time and effort necessary to develop and implement required changes (including the impact to information technology systems) extends into 2018. Although the transition approach on
adoption has not yet been determined, it is anticipated that the adoption of IFRS 16 will have a material impact on the Consolidated Balance Sheets.
|
|
|
| Cenovus Energy Inc. First Quarter 2017 Report |
|
Page 51 Notes to
Consolidated Financial Statements |
NOTES TO CONSOLIDATED FINANCIAL STATEMENTS (unaudited)
All amounts in $ millions, unless otherwise indicated
For the period ended March 31, 2017
4. FINANCE COSTS
|
|
|
|
|
|
|
| |
|
Three Months Ended |
| For the periods ended March 31, |
|
2017 |
|
|
|
2016 |
|
|
|
|
| Interest Expense – Short-Term Borrowings and Long-Term Debt |
|
85 |
|
|
|
88 |
| Unwinding of Discount on Decommissioning Liabilities (Note 14) |
|
26 |
|
|
|
32 |
| Other |
|
9 |
|
|
|
4 |
|
|
120 |
|
|
|
124 |
5. FOREIGN EXCHANGE (GAIN) LOSS, NET
|
|
|
|
|
|
|
| |
|
Three Months Ended |
| For the periods ended March 31, |
|
2017 |
|
|
|
2016 |
|
|
|
|
| Unrealized Foreign Exchange (Gain) Loss on Translation of: |
|
|
|
|
|
|
| U.S. Dollar Debt Issued From Canada |
|
(56) |
|
|
|
(413) |
| Other |
|
(16) |
|
|
|
4 |
| Unrealized Foreign Exchange (Gain) Loss |
|
(72) |
|
|
|
(409) |
| Realized Foreign Exchange (Gain) Loss |
|
(4) |
|
|
|
6 |
|
|
(76) |
|
|
|
(403) |
6. IMPAIRMENT CHARGES
A) Cash-Generating Unit
(“CGU”) Impairments
2017 Upstream Impairments
As at March 31, 2017, there were no indicators of impairment.
For
the purpose of impairment testing, goodwill is allocated to the CGU to which it relates. There were no goodwill impairments for the three months ended March 31, 2017.
2016 Upstream Impairments
Due to a decline in forward commodity prices as at March 31, 2016, the Company tested its upstream CGUs for impairment. The Company determined that
the carrying amount of the Northern Alberta CGU exceeded its recoverable amount, resulting in an impairment loss of $170 million. The impairment was recorded as additional depreciation, depletion and amortization (“DD&A”) in the
Conventional segment.
As at March 31, 2016, the recoverable amount of the Northern Alberta CGU was estimated to be approximately
$1.3 billion based on the fair value less costs of disposal. The fair value of producing properties was calculated based on discounted after-tax cash flows of proved and probable reserves using forward
prices and cost estimates, prepared by Cenovus’s IQREs (Level 3). Future cash flows were estimated using a two percent inflation rate and discounted using a rate of 10 percent. Forward prices as at March 31, 2016 used to determine
future cash flows from crude oil and natural gas reserves were:
|
|
|
|
|
|
|
|
|
|
|
|
|
| |
|
Remainder
of 2016 |
|
2017 |
|
2018 |
|
2019 |
|
2020 |
|
Average
Annual % Change to 2026 |
|
|
|
|
|
|
|
| WTI (US$/barrel) (1) |
|
45.00 |
|
51.00 |
|
59.80 |
|
66.30 |
|
70.40 |
|
3.9% |
| WCS (C$/barrel) (2) |
|
43.40 |
|
50.10 |
|
57.00 |
|
63.60 |
|
65.50 |
|
4.0% |
| AECO (C$/Mcf) (3) (4) |
|
2.10 |
|
3.00 |
|
3.35 |
|
3.65 |
|
3.75 |
|
3.7% |
|
|
|
|
|
|
|
|
|
|
|
|
|
| (1) |
West Texas Intermediate (“WTI”) crude oil. |
| (2) |
Western Canadian Select (“WCS”) crude oil blend. |
| (3) |
Alberta Energy Company (“AECO”) natural gas. |
| (4) |
Assumes gas heating value of one million British Thermal Units per thousand cubic feet. |
There were no impairments
of goodwill for the three months ended March 31, 2016.
|
|
|
| Cenovus Energy Inc. First Quarter 2017 Report |
|
Page 52 Notes to
Consolidated Financial Statements |
NOTES TO CONSOLIDATED FINANCIAL STATEMENTS (unaudited)
All amounts in $ millions, unless otherwise indicated
For the period ended March 31, 2017
B) Asset Impairment
For the three months ended March 31, 2017, $3 million of previously capitalized E&E costs were deemed not to be technically feasible and
commercially viable. This impairment loss was recorded as exploration expense in the Conventional segment.
7. INCOME TAXES
The provision for income taxes is:
|
|
|
|
|
|
|
| |
|
Three Months Ended |
| For the periods ended March 31, |
|
2017 |
|
|
|
2016 |
|
|
|
|
| Current Tax |
|
|
|
|
|
|
| Canada |
|
(21) |
|
|
|
(27) |
| United States |
|
(1) |
|
|
|
- |
| Total Current Tax Expense (Recovery) |
|
(22) |
|
|
|
(27) |
| Deferred Tax Expense (Recovery) |
|
71 |
|
|
|
(190) |
|
|
49 |
|
|
|
(217) |
The following table reconciles income taxes calculated at the Canadian statutory rate with recorded income taxes:
|
|
|
|
|
|
|
| |
|
Three Months Ended |
| For the periods ended March 31, |
|
2017 |
|
|
|
2016 |
|
|
|
|
| Earnings (Loss) Before Income Tax |
|
260 |
|
|
|
(335) |
| Canadian Statutory Rate |
|
27.0% |
|
|
|
27.0% |
| Expected Income Tax (Recovery) |
|
70 |
|
|
|
(90) |
| Effect of Taxes Resulting From: |
|
|
|
|
|
|
| Foreign Tax Rate Differential |
|
(15) |
|
|
|
(27) |
| Non-Deductible Stock-Based Compensation |
|
2 |
|
|
|
2 |
| Non-Taxable Capital (Gains) Losses |
|
(7) |
|
|
|
(56) |
| Unrecognized Capital (Gains) Losses Arising From Unrealized Foreign Exchange |
|
(7) |
|
|
|
(56) |
| Other |
|
6 |
|
|
|
10 |
| Total Tax (Recovery) |
|
49 |
|
|
|
(217) |
| Effective Tax Rate |
|
18.8% |
|
|
|
64.8% |
8. PER SHARE AMOUNTS
A) Net Earnings (Loss) Per Share
|
|
|
|
|
|
|
| |
|
Three Months Ended |
| For the periods ended March 31, |
|
2017 |
|
|
|
2016 |
|
|
|
|
| Net Earnings (Loss) – Basic and Diluted ($ millions) |
|
211 |
|
|
|
(118) |
|
|
|
|
| Weighted Average Number of Shares – Basic and Diluted (millions) |
|
833.3 |
|
|
|
833.3 |
|
|
|
|
| Net Earnings (Loss) Per Share – Basic and Diluted ($) |
|
0.25 |
|
|
|
(0.14) |
B) Dividends Per Share
For the three
months ended March 31, 2017, the Company paid dividends of $41 million or $0.05 per share (three months ended March 31, 2016 – $41 million or $0.05 per share).
9. INVENTORIES
Cenovus recorded a write-down of its refined product inventory of $10 million from cost to net realizable value as at March 31, 2017. As at
December 31, 2016, Cenovus recorded a write-down of its product inventory of $4 million.
|
|
|
| Cenovus Energy Inc. First Quarter 2017 Report |
|
Page 53 Notes to
Consolidated Financial Statements |
NOTES TO CONSOLIDATED FINANCIAL STATEMENTS (unaudited)
All amounts in $ millions, unless otherwise indicated
For the period ended March 31, 2017
10. ASSETS AND LIABILITIES HELD FOR SALE
On March 29, 2017, Cenovus entered into a
purchase and sale agreement with ConocoPhillips to acquire ConocoPhillips’ 50 percent interest in FCCL and the majority of ConocoPhillips’ western Canadian conventional crude oil and natural gas assets (this acquisition is referred to
in these interim Consolidated Financial Statements as the “Acquisition”) (see Note 24). Concurrent with the Acquisition, the Company commenced marketing for sale certain non-core properties
comprising its Pelican Lake heavy oil assets, including the adjacent Grand Rapids project in the Greater Pelican Lake region, and its Suffield crude oil and natural gas assets. These assets have been reclassified as held for sale as at
March 31, 2017 and recorded at the lesser of their carrying amount and fair value less costs to sell.
Assets and liabilities classified as held for sale consist
of the following:
|
|
|
|
|
|
|
|
|
|
|
|
|
|
|
| |
|
|
|
|
|
E&E Assets |
|
|
|
PP&E |
|
|
|
Decommissioning
Liabilities |
| Description |
|
Segment |
|
|
|
(Note 11) |
|
|
|
(Note 12) |
|
|
|
(Note 14) |
|
|
|
|
|
|
|
|
| Pelican Lake |
|
Conventional |
|
|
|
- |
|
|
|
1,297 |
|
|
|
113 |
| Suffield |
|
Conventional |
|
|
|
- |
|
|
|
628 |
|
|
|
508 |
| Grand Rapids |
|
Oil Sands |
|
|
|
257 |
|
|
|
70 |
|
|
|
17 |
|
|
|
|
|
|
257 |
|
|
|
1,995 |
|
|
|
638 |
11. EXPLORATION AND EVALUATION ASSETS
|
|
|
| |
|
Total |
|
|
| As at December 31, 2016 |
|
1,585 |
| Additions |
|
43 |
| Transfers to Assets Held for Sale (Note 10) |
|
(257) |
| Exploration Expense (Note 6) |
|
(3) |
| Change in Decommissioning Liabilities |
|
1 |
| As at March 31, 2017 |
|
1,369 |
12. PROPERTY, PLANT AND EQUIPMENT, NET
|
|
|
|
|
|
|
|
|
|
|
|
|
|
|
|
|
|
|
| |
|
Upstream Assets |
|
|
|
|
|
|
|
|
|
|
|
|
| |
|
Development
& Production |
|
|
|
Other
Upstream |
|
|
|
Refining
Equipment |
|
|
|
Other (1) |
|
|
|
Total |
|
|
|
|
|
|
|
|
|
|
| COST |
|
|
|
|
|
|
|
|
|
|
|
|
|
|
|
|
|
|
| As at December 31, 2016 |
|
31,941 |
|
|
|
333 |
|
|
|
5,259 |
|
|
|
1,074 |
|
|
|
38,607 |
| Additions |
|
217 |
|
|
|
- |
|
|
|
46 |
|
|
|
7 |
|
|
|
270 |
| Transfers to Assets Held for Sale (Note 10) |
|
(9,597) |
|
|
|
- |
|
|
|
- |
|
|
|
- |
|
|
|
(9,597) |
| Change in Decommissioning Liabilities |
|
146 |
|
|
|
- |
|
|
|
3 |
|
|
|
1 |
|
|
|
150 |
| Exchange Rate Movements and Other |
|
- |
|
|
|
- |
|
|
|
(46) |
|
|
|
2 |
|
|
|
(44) |
| Divestitures |
|
(1) |
|
|
|
- |
|
|
|
- |
|
|
|
- |
|
|
|
(1) |
| As at March 31, 2017 |
|
22,706 |
|
|
|
333 |
|
|
|
5,262 |
|
|
|
1,084 |
|
|
|
29,385 |
|
|
|
|
|
|
|
|
|
|
| ACCUMULATED DEPRECIATION, DEPLETION AND AMORTIZATION |
|
|
|
|
|
|
|
|
|
|
|
|
|
|
|
|
|
|
| As at December 31, 2016 |
|
20,088 |
|
|
|
308 |
|
|
|
1,076 |
|
|
|
709 |
|
|
|
22,181 |
| DD&A |
|
284 |
|
|
|
6 |
|
|
|
52 |
|
|
|
21 |
|
|
|
363 |
| Transfers to Assets Held for Sale (Note 10) |
|
(7,602) |
|
|
|
- |
|
|
|
- |
|
|
|
- |
|
|
|
(7,602) |
| Exchange Rate Movements and Other |
|
12 |
|
|
|
- |
|
|
|
(7) |
|
|
|
(1) |
|
|
|
4 |
| As at March 31, 2017 |
|
12,782 |
|
|
|
314 |
|
|
|
1,121 |
|
|
|
729 |
|
|
|
14,946 |
|
|
|
|
|
|
|
|
|
|
| CARRYING VALUE |
|
|
|
|
|
|
|
|
|
|
|
|
|
|
|
|
|
|
| As at December 31, 2016 |
|
11,853 |
|
|
|
25 |
|
|
|
4,183 |
|
|
|
365 |
|
|
|
16,426 |
| As at March 31, 2017 |
|
9,924 |
|
|
|
19 |
|
|
|
4,141 |
|
|
|
355 |
|
|
|
14,439 |
(1) Includes crude-by-rail terminal, office furniture, fixtures, leasehold improvements, information technology and
aircraft.
|
|
|
| Cenovus Energy Inc. First Quarter 2017 Report |
|
Page 54 Notes to
Consolidated Financial Statements |
NOTES TO CONSOLIDATED FINANCIAL STATEMENTS (unaudited)
All amounts in $ millions, unless otherwise indicated
For the period ended March 31, 2017
13. LONG-TERM DEBT
|
|
|
|
|
|
|
|
|
|
|
| As at |
|
US$ Principal |
|
|
|
March 31,
2017 |
|
|
|
December 31,
2016 |
|
|
|
|
|
|
| Revolving Term Debt (1) |
|
- |
|
|
|
- |
|
|
|
- |
| U.S. Dollar Denominated Unsecured Notes |
|
4,750 |
|
|
|
6,322 |
|
|
|
6,378 |
| Total Debt Principal |
|
|
|
|
|
6,322 |
|
|
|
6,378 |
| Debt Discounts and Transaction Costs |
|
|
|
|
|
(45) |
|
|
|
(46) |
|
|
|
|
|
|
6,277 |
|
|
|
6,332 |
| (1) |
Revolving term debt may include Bankers’ Acceptances, London Interbank Offered Rate based loans, prime rate loans and U.S. base rate loans. |
Cenovus has in place a committed credit facility that consists of a $1.0 billion tranche maturing on April 30, 2019 and a $3.0 billion
tranche maturing on November 30, 2019. As at March 31, 2017, Cenovus had $4.0 billion available on its committed credit facility.
On
February 24, 2016, Cenovus filed a base shelf prospectus. The base shelf prospectus allows the Company to offer, from time to time, up to US$5.0 billion, or the equivalent in other currencies, of debt securities, common shares, preferred
shares, subscription receipts, warrants, share purchase contracts and units in Canada, the U.S. and elsewhere where permitted by law. The base shelf prospectus will expire in March 2018. As at March 31, 2017, no issuances have been made under
the US$5.0 billion base shelf prospectus.
In connection with the Acquisition (see Note 24), Cenovus closed a bought-deal common share financing
on April 6, 2017 under the base shelf prospectus for gross proceeds of $3.0 billion. As at April 6, 2017, US$2.8 billion was available under the base shelf prospectus.
As at March 31, 2017, the Company is in compliance with all of the terms of its debt agreements.
14. DECOMMISSIONING LIABILITIES
The decommissioning provision represents the present value of the expected future costs associated with the retirement of upstream crude oil and natural gas assets,
refining facilities and the crude-by-rail terminal. The aggregate carrying amount of the obligation is:
|
|
|
| |
|
Total |
|
|
| As at December 31, 2016 |
|
1,847 |
| Liabilities Incurred |
|
6 |
| Liabilities Settled |
|
(23) |
| Transfers to Assets Held for Sale (Note 10) |
|
(638) |
| Change in Estimated Future Cash Flows |
|
(5) |
| Change in Discount Rate |
|
150 |
| Unwinding of Discount on Decommissioning Liabilities |
|
26 |
| As at March 31, 2017 |
|
1,363 |
The undiscounted amount of estimated future cash flows required to settle the obligation has been discounted using a credit-adjusted risk-free rate of 5.4 percent as at March 31, 2017 (December 31, 2016 – 5.9 percent).
15. OTHER LIABILITIES
|
|
|
|
|
|
|
| As at |
|
March 31,
2017 |
|
|
|
December 31,
2016 |
|
|
|
|
| Employee Long-Term Incentives |
|
60 |
|
|
|
72 |
| Pension and Other Post-Employment Benefit Plan |
|
78 |
|
|
|
71 |
| Onerous Contract Provisions |
|
40 |
|
|
|
35 |
| Other |
|
35 |
|
|
|
33 |
|
|
213 |
|
|
|
211 |
|
|
|
| Cenovus Energy Inc. First Quarter 2017 Report |
|
Page 55 Notes to
Consolidated Financial Statements |
NOTES TO CONSOLIDATED FINANCIAL STATEMENTS (unaudited)
All amounts in $ millions, unless otherwise indicated
For the period ended March 31, 2017
16. SHARE CAPITAL
A) Authorized
Cenovus is authorized to issue an unlimited number of common shares, and first and second preferred shares not exceeding, in aggregate, 20 percent of
the number of issued and outstanding common shares. The first and second preferred shares may be issued in one or more series with rights and conditions to be determined by the Company’s Board of Directors prior to issuance and subject to the
Company’s articles.
B) Issued and Outstanding
|
|
|
|
|
|
|
| As at March 31, 2017 |
|
Number of
Common Shares
(thousands) |
|
|
|
Amount |
|
|
|
|
| Outstanding, Beginning of Year and End of Period |
|
833,290 |
|
|
|
5,534 |
There were no preferred shares outstanding as at March 31, 2017 (December 31, 2016 – nil).
As at March 31, 2017, there were 15 million (December 31, 2016 – 12 million) common shares available for future issuance under the stock
option plan.
In connection with the Acquisition (see Note 24), Cenovus closed a bought-deal common share financing on April 6, 2017
for 187.5 million common shares, raising gross proceeds of $3.0 billion.
17. ACCUMULATED OTHER COMPREHENSIVE INCOME (LOSS)
|
|
|
|
|
|
|
|
|
|
|
|
|
|
|
| |
|
Defined
Benefit Pension
Plan |
|
|
|
Foreign
Currency
Translation
Adjustment |
|
|
|
Available
for Sale
Financial
Assets |
|
|
|
Total |
|
|
|
|
|
|
|
|
| As at December 31, 2015 |
|
(10) |
|
|
|
1,014 |
|
|
|
16 |
|
|
|
1,020 |
| Other Comprehensive Income (Loss), Before Tax |
|
(5) |
|
|
|
(256) |
|
|
|
(4) |
|
|
|
(265) |
| Income Tax |
|
1 |
|
|
|
- |
|
|
|
1 |
|
|
|
2 |
| As at March 31, 2016 |
|
(14) |
|
|
|
758 |
|
|
|
13 |
|
|
|
757 |
|
|
|
|
|
|
|
|
|
|
|
|
|
|
|
| As at December 31, 2016 |
|
(13) |
|
|
|
908 |
|
|
|
15 |
|
|
|
910 |
| Other Comprehensive Income (Loss), Before Tax |
|
(4) |
|
|
|
(43) |
|
|
|
- |
|
|
|
(47) |
| Income Tax |
|
1 |
|
|
|
- |
|
|
|
- |
|
|
|
1 |
| As at March 31, 2017 |
|
(16) |
|
|
|
865 |
|
|
|
15 |
|
|
|
864 |
|
|
|
| Cenovus Energy Inc. First Quarter 2017 Report |
|
Page 56 Notes to
Consolidated Financial Statements |
NOTES TO CONSOLIDATED FINANCIAL STATEMENTS (unaudited)
All amounts in $ millions, unless otherwise indicated
For the period ended March 31, 2017
18. STOCK-BASED COMPENSATION PLANS
Cenovus has a number of stock-based
compensation plans which include stock options with associated net settlement rights (“NSRs”), stock options with associated tandem stock appreciation rights (“TSARs”), performance share units (“PSUs”), restricted share
units (“RSUs”) and deferred share units (“DSUs”). The following table summarizes information related to Cenovus’s stock-based compensation plans:
|
|
|
|
|
|
|
| As at March 31, 2017 |
|
Units
Outstanding
(thousands) |
|
|
|
Units
Exercisable
(thousands) |
|
|
|
|
| NSRs |
|
41,545 |
|
|
|
36,152 |
| TSARs |
|
1,024 |
|
|
|
1,024 |
| PSUs |
|
4,914 |
|
|
|
- |
| RSUs |
|
3,659 |
|
|
|
- |
| DSUs |
|
1,707 |
|
|
|
1,707 |
|
|
|
|
| For the three months ended March 31, 2017 |
|
Units
Granted (thousands) |
|
|
|
Units
Vested and Paid
Out (thousands) |
|
|
|
|
| NSRs |
|
- |
|
|
|
- |
| PSUs |
|
- |
|
|
|
451 |
| RSUs |
|
- |
|
|
|
101 |
| DSUs |
|
104 |
|
|
|
- |
Certain directors, officers or employees chose prior to December 31, 2016 to convert a portion of their remuneration,
paid in the first quarter of 2017, into DSUs. The election for any particular year is irrevocable. DSUs may not be redeemed until departure from the Company. Directors also received an annual grant of DSUs.
The weighted average exercise price of NSRs and TSARs as at March 31, 2017 was $30.57 and $27.46, respectively.
The following table summarizes the stock-based compensation expense (recovery) recorded for all plans:
|
|
|
|
|
|
|
| |
|
Three Months Ended |
| For the periods ended March 31, |
|
2017 |
|
|
|
2016 |
|
|
|
|
| NSRs |
|
2 |
|
|
|
4 |
| TSARs |
|
- |
|
|
|
- |
| PSUs |
|
(6) |
|
|
|
(8) |
| RSUs |
|
(3) |
|
|
|
3 |
| DSUs |
|
(7) |
|
|
|
(1) |
| Stock-Based Compensation Expense (Recovery) |
|
(14) |
|
|
|
(2) |
| Stock-Based Compensation Costs Capitalized |
|
(1) |
|
|
|
(1) |
| Total Stock-Based Compensation |
|
(15) |
|
|
|
(3) |
19. CAPITAL STRUCTURE
Cenovus’s capital structure objectives
and targets have remained unchanged from previous periods. Cenovus’s capital structure consists of Shareholders’ Equity plus Debt. Debt is defined as short-term borrowings, and the current and long-term portions of long-term debt. Net debt
includes the Company’s short-term borrowings, and the current and long-term portions of long-term debt, net of cash and cash equivalents. Cenovus’s objectives when managing its capital structure are to maintain financial flexibility,
preserve access to capital markets, ensure its ability to finance internally generated growth and to fund potential acquisitions while maintaining the ability to meet the Company’s financial obligations as they come due.
Cenovus monitors its capital structure and financing requirements using, among other things, non-GAAP financial
measures consisting of Debt to Capitalization and Debt to Adjusted Earnings Before Interest, Taxes and DD&A (“Adjusted EBITDA”). These measures are used to steward Cenovus’s overall debt position as measures of Cenovus’s
overall financial strength.
Over the long term, Cenovus targets a Debt to Capitalization ratio of between 30 and 40 percent and a Debt to
Adjusted EBITDA ratio of between 1.0 and 2.0 times. At different points within the economic cycle, Cenovus expects these ratios may periodically be outside of the target range.
|
|
|
| Cenovus Energy Inc. First Quarter 2017 Report |
|
Page 57 Notes to
Consolidated Financial Statements |
NOTES TO CONSOLIDATED FINANCIAL STATEMENTS (unaudited)
All amounts in $ millions, unless otherwise indicated
For the period ended March 31, 2017
A) Debt to Capitalization and Net Debt to Capitalization
|
|
|
|
|
|
|
| As at |
|
March 31,
2017 |
|
|
|
December 31,
2016 |
|
|
|
|
| Debt |
|
6,277 |
|
|
|
6,332 |
| Shareholders’ Equity |
|
11,717 |
|
|
|
11,590 |
|
|
17,994 |
|
|
|
17,922 |
| Debt to Capitalization |
|
35% |
|
|
|
35% |
|
|
|
|
| Debt |
|
6,277 |
|
|
|
6,332 |
| Add (Deduct): |
|
|
|
|
|
|
| Cash and Cash Equivalents |
|
(3,548) |
|
|
|
(3,720) |
| Net Debt |
|
2,729 |
|
|
|
2,612 |
| Shareholders’ Equity |
|
11,717 |
|
|
|
11,590 |
|
|
14,446 |
|
|
|
14,202 |
| Net Debt to Capitalization |
|
19% |
|
|
|
18% |
B) Debt to Adjusted EBITDA and Net Debt to Adjusted EBITDA
|
|
|
|
|
|
|
| As at |
|
March 31,
2017 |
|
|
|
December 31,
2016 |
|
|
|
|
| Debt |
|
6,277 |
|
|
|
6,332 |
| Net Debt |
|
2,729 |
|
|
|
2,612 |
|
|
|
|
| Net Earnings (Loss) |
|
(216) |
|
|
|
(545) |
| Add (Deduct): |
|
|
|
|
|
|
| Finance Costs |
|
488 |
|
|
|
492 |
| Interest Income |
|
(58) |
|
|
|
(52) |
| Income Tax Expense (Recovery) |
|
(116) |
|
|
|
(382) |
| DD&A |
|
1,319 |
|
|
|
1,498 |
| E&E Impairment |
|
4 |
|
|
|
2 |
| Unrealized (Gain) Loss on Risk Management |
|
126 |
|
|
|
554 |
| Foreign Exchange (Gain) Loss, Net |
|
129 |
|
|
|
(198) |
| (Gain) Loss on Divestitures of Assets |
|
7 |
|
|
|
6 |
| Other (Income) Loss, Net |
|
34 |
|
|
|
34 |
| Adjusted EBITDA (1) |
|
1,717 |
|
|
|
1,409 |
|
|
|
|
| Debt to Adjusted EBITDA |
|
3.7x |
|
|
|
4.5x |
| Net Debt to Adjusted EBITDA |
|
1.6x |
|
|
|
1.9x |
| (1) |
Calculated on a trailing twelve-month basis. |
Cenovus will maintain a high level of capital
discipline and manage its capital structure to help ensure sufficient liquidity through all stages of the economic cycle. To manage its capital structure, Cenovus may, among other actions, adjust capital and operating spending, adjust dividends paid
to shareholders, purchase shares for cancellation pursuant to normal course issuer bids, issue new shares, issue new debt, draw down on its credit facility or repay existing debt.
Cenovus has in place a committed credit facility that consists of a $1.0 billion tranche maturing on April 30, 2019 and a $3.0 billion
tranche maturing on November 30, 2019. As at March 31, 2017, Cenovus had $4.0 billion available on its committed credit facility. Under the committed credit facility, the Company is required to maintain a debt to capitalization
ratio, as defined in the agreement, not to exceed 65 percent. The Company is well below this limit.
In addition, as at March 31, 2017,
Cenovus has in place a US$5.0 billion base shelf prospectus, the availability of which is dependent on market conditions. In connection with the Acquisition (see Note 24), Cenovus closed a bought-deal common share financing on
April 6, 2017 under the base shelf prospectus for 187.5 million common shares, raising gross proceeds of $3.0 billion. As at April 6, 2017, US$2.8 billion remains available under the base shelf prospectus.
As at March 31, 2017, Cenovus is in compliance with all of the terms of its debt agreements.
|
|
|
| Cenovus Energy Inc. First Quarter 2017 Report |
|
Page 58 Notes to
Consolidated Financial Statements |
NOTES TO CONSOLIDATED FINANCIAL STATEMENTS (unaudited)
All amounts in $ millions, unless otherwise indicated
For the period ended March 31, 2017
20. FINANCIAL INSTRUMENTS
Cenovus’s financial assets and financial
liabilities consist of cash and cash equivalents, accounts receivable and accrued revenues, accounts payable and accrued liabilities, risk management assets and liabilities, available for sale financial assets, long-term receivables, short-term
borrowings and long-term debt. Risk management assets and liabilities arise from the use of derivative financial instruments.
A) Fair Value
of Non-Derivative Financial Instruments
The fair values of cash and cash equivalents, accounts receivable
and accrued revenues, accounts payable and accrued liabilities, and short-term borrowings approximate their carrying amount due to the short-term maturity of these instruments.
The fair values of long-term receivables approximate their carrying amount due to the specific non-tradeable
nature of these instruments.
Long-term debt is carried at amortized cost. The estimated fair values of long-term borrowings have been determined
based on period-end trading prices of long-term borrowings on the secondary market (Level 2). As at March 31, 2017, the carrying value of Cenovus’s long-term debt was $6,277 million and the fair
value was $6,589 million (December 31, 2016 carrying value – $6,332 million, fair value – $6,539 million).
Available for sale
financial assets comprise private equity investments. These assets are carried at fair value on the Consolidated Balance Sheets in other assets. Fair value is determined based on recent private placement transactions (Level 3) when available. There
were no changes to the fair value of available for sale financial assets in the three months ended March 31, 2017.
B) Fair Value of
Risk Management Assets and Liabilities
The Company’s risk management assets and liabilities consist of crude oil, condensate, foreign
exchange contracts and interest rate swaps. Crude oil, condensate and, if entered, natural gas contracts, are recorded at their estimated fair value based on the difference between the contracted price and the
period-end forward price for the same commodity, using quoted market prices or the period-end forward price for the same commodity extrapolated to the end of the term of
the contract (Level 2). The fair value of interest rate swaps and foreign exchange contracts are calculated using external valuation models which incorporate observable market data, including interest rate yield curves (Level 2).
Summary of Unrealized Risk Management Positions
|
|
|
|
|
|
|
|
|
|
|
|
|
|
|
|
|
|
|
|
|
|
|
|
|
|
|
|
|
|
|
|
|
|
|
| |
|
March 31, 2017 |
|
|
|
|
December 31, 2016 |
|
| |
|
Risk Management |
|
Risk Management |
|
| As at |
|
Asset |
|
|
|
|
Liability |
|
|
|
|
Net |
|
|
|
|
Asset |
|
|
|
|
Liability |
|
|
|
|
Net |
|
|
|
|
|
|
|
|
|
|
|
|
|
| Crude Oil |
|
|
33 |
|
|
|
|
|
65 |
|
|
|
|
|
(32) |
|
|
|
|
|
21 |
|
|
|
|
|
307 |
|
|
|
|
|
(286) |
|
| Interest Rate |
|
|
4 |
|
|
|
|
|
5 |
|
|
|
|
|
(1) |
|
|
|
|
|
3 |
|
|
|
|
|
8 |
|
|
|
|
|
(5) |
|
| Foreign Exchange |
|
|
26 |
|
|
|
|
|
2 |
|
|
|
|
|
24 |
|
|
|
|
|
- |
|
|
|
|
|
- |
|
|
|
|
|
- |
|
| Total Fair Value |
|
|
63 |
|
|
|
|
|
72 |
|
|
|
|
|
(9) |
|
|
|
|
|
24 |
|
|
|
|
|
315 |
|
|
|
|
|
(291) |
|
The following table presents the Company’s fair value hierarchy for risk management assets and liabilities carried at fair value:
|
|
|
|
|
|
|
| As at |
|
March 31,
2017 |
|
|
|
December 31,
2016 |
|
|
|
|
| Level 2 – Prices Sourced From Observable Data or Market Corroboration |
|
(9) |
|
|
|
(291) |
Prices sourced from observable data or market corroboration refers to the fair value of contracts valued in part using active quotes and
in part using observable, market-corroborated data.
|
|
|
| Cenovus Energy Inc. First Quarter 2017 Report |
|
Page 59 Notes to
Consolidated Financial Statements |
NOTES TO CONSOLIDATED FINANCIAL STATEMENTS (unaudited)
All amounts in $ millions, unless otherwise indicated
For the period ended March 31, 2017
The following table provides a reconciliation of changes in the fair value of Cenovus’s risk
management assets and liabilities from January 1 to March 31:
|
|
|
|
|
|
|
|
|
|
|
| |
|
2017 |
|
|
|
|
2016 |
|
|
|
|
|
| Fair Value of Contracts, Beginning of Year |
|
|
(291 |
) |
|
|
|
|
271 |
|
| Fair Value of Contracts Realized During the Period |
|
|
92 |
|
|
|
|
|
(165 |
) |
| Change in Fair Value of Contracts in Place at Beginning of Year and Contracts Entered Into During the
Period |
|
|
187 |
|
|
|
|
|
16 |
|
| Unrealized Foreign Exchange Gain (Loss) on U.S. Dollar Contracts |
|
|
3 |
|
|
|
|
|
(15 |
) |
| Fair Value of Contracts, End of Period |
|
|
(9 |
) |
|
|
|
|
107 |
|
C) Earnings Impact of (Gains) Losses From Risk Management Positions
|
|
|
|
|
|
|
|
|
|
|
| |
|
Three Months Ended |
|
| For the periods ended March 31, |
|
2017 |
|
|
|
|
2016 |
|
|
|
|
|
| Realized (Gain) Loss (1) |
|
|
92 |
|
|
|
|
|
(165 |
) |
| Unrealized (Gain) Loss (2) |
|
|
(279 |
) |
|
|
|
|
149 |
|
| (Gain) Loss on Risk Management |
|
|
(187 |
) |
|
|
|
|
(16 |
) |
| (1) |
Realized gains and losses on risk management are recorded in the reportable segment to which the derivative instrument relates. |
| (2) |
Unrealized gains and losses on risk management are recorded in the Corporate and Eliminations segment. |
21.
RISK MANAGEMENT
Cenovus is exposed
to financial risks, including market risk related to commodity prices, foreign exchange rates, interest rates as well as credit risk and liquidity risk. A description of the nature and extent of risks arising from the Company’s financial assets
and liabilities can be found in the notes to the annual Consolidated Financial Statements as at December 31, 2016. Exposure to these risks has not changed significantly since December 31, 2016. To manage exposure to interest rate
volatility, the Company entered into interest rate swap contracts related to expected future debt issuances. As at March 31, 2017, Cenovus had a notional amount of US$400 million in interest rate swaps. To mitigate the Company’s
exposure to foreign exchange rate fluctuations, the Company periodically enters into foreign exchange contracts. As at March 31, 2017, the Company had a notional amount of approximately US$4.8 billion in foreign exchange forwards and
options entered into in anticipation of the Acquisition (see Note 24).
Net Fair Value of Risk Management Positions
|
|
|
|
|
|
|
|
|
|
|
|
|
|
|
|
|
| As at March 31, 2017 |
|
Notional Volumes |
|
|
|
Terms |
|
|
|
Average Price |
|
|
|
Fair Value |
|
|
|
|
|
|
|
|
|
| Crude Oil Contracts |
|
|
|
|
|
|
|
|
|
|
|
|
|
|
|
|
| Fixed Price Contracts |
|
|
|
|
|
|
|
|
|
|
|
|
|
|
|
|
| Brent Fixed Price |
|
10,000 bbls/d |
|
|
|
July – December 2017 |
|
|
|
US$53.09/bbl |
|
|
|
|
(3 |
) |
| Brent Fixed Price |
|
10,000 bbls/d |
|
|
|
January – June 2018 |
|
|
|
US$54.06/bbl |
|
|
|
|
- |
|
| WTI Fixed Price |
|
70,000 bbls/d |
|
|
|
January – June 2017 |
|
|
|
US$46.35/bbl |
|
|
|
|
(40 |
) |
| Brent-WTI Differential |
|
50,000 bbls/d |
|
|
|
July – December 2017 |
|
|
|
US$(1.88)/bbl |
|
|
|
|
(4 |
) |
|
|
|
|
|
|
|
|
| Brent Collars |
|
10,000 bbls/d |
|
|
|
January – June 2018 |
|
|
|
US$46.30 – US$64.95/bbl |
|
|
|
|
2 |
|
| WTI Collars |
|
50,000 bbls/d |
|
|
|
July – December 2017 |
|
|
|
US$44.84 – US$56.47/bbl |
|
|
|
|
(10 |
) |
| WTI Collars |
|
10,000 bbls/d |
|
|
|
January – June 2018 |
|
|
|
US$45.30 –
US$62.77/bbl |
|
|
|
|
2 |
|
| Other Financial Positions (1)
|
|
|
|
|
|
|
|
|
|
|
|
|
|
|
21 |
|
| Crude Oil Fair Value Position |
|
|
|
|
|
|
|
|
|
|
|
|
|
|
(32 |
) |
|
|
|
|
|
|
|
|
| Interest Rate Swaps |
|
|
|
|
|
|
|
|
|
|
|
|
|
|
(1 |
) |
|
|
|
|
|
|
|
|
| Foreign Exchange Forwards and Options |
|
|
|
|
|
|
|
|
|
|
|
|
|
|
24 |
|
|
|
|
|
|
|
|
|
| Total Fair Value |
|
|
|
|
|
|
|
|
|
|
|
|
|
|
(9 |
) |
| (1) |
Other financial positions are part of ongoing operations to market the Company’s production. |
|
|
|
| Cenovus Energy Inc. First Quarter 2017 Report |
|
Page 60 Notes to
Consolidated Financial Statements |
NOTES TO CONSOLIDATED FINANCIAL STATEMENTS (unaudited)
All amounts in $ millions, unless otherwise indicated
For the period ended March 31, 2017
Sensitivities – Risk Management Positions
The following table summarizes the sensitivity of the fair value of Cenovus’s risk management positions to fluctuations in commodity prices, interest
rates or foreign exchange rates, with all other variables held constant. Management believes the fluctuations identified in the table below are a reasonable measure of volatility. The impact of fluctuating commodity prices, interest rates or foreign
exchange rates on the Company’s open risk management positions could have resulted in unrealized gains (losses) impacting earnings before income tax as follows:
Risk Management Positions in Place as at March 31, 2017
|
|
|
|
|
|
|
|
|
|
|
|
|
|
|
| |
|
Sensitivity Range |
|
Increase |
|
|
|
|
|
Decrease |
|
|
|
|
|
|
| Crude Oil Commodity Price |
|
± US$5.00 per bbl Applied to Brent, WTI and Condensate Hedges |
|
|
(154 |
) |
|
|
|
|
|
|
151 |
|
| Interest Rate Swaps |
|
± 50 Basis Points |
|
|
44 |
|
|
|
|
|
|
|
(51 |
) |
| Foreign Exchange Forwards |
|
± $0.025 Change in U.S./Canadian Dollar Exchange Rate |
|
|
78 |
|
|
|
|
|
|
|
(78 |
) |
| Foreign Exchange Options |
|
± $0.025 Change in U.S./Canadian Dollar Exchange Rate |
|
|
40 |
|
|
|
|
|
|
|
(29 |
) |
22. SUPPLEMENTARY CASH FLOW INFORMATION
Reconciliation of Liabilities to
Cash Flows Arising From Financing Activities
|
|
|
|
|
|
|
|
|
|
|
|
|
|
|
|
|
|
|
|
|
|
|
|
|
|
|
|
|
| |
|
Other
Assets |
|
|
|
|
|
Dividends
Payable |
|
|
|
|
|
Short-Term
Borrowings |
|
|
|
|
|
Long-Term
Debt |
|
|
|
|
|
|
|
|
|
| As at December 31, 2015 |
|
|
76 |
|
|
|
|
|
|
|
- |
|
|
|
|
|
|
|
- |
|
|
|
|
|
|
|
6,525 |
|
| Changes From Financing Cash Flows: |
|
|
|
|
|
|
|
|
|
|
|
|
|
|
|
|
|
|
|
|
|
|
|
|
|
|
|
|
| Dividends Paid |
|
|
- |
|
|
|
|
|
|
|
(41 |
) |
|
|
|
|
|
|
- |
|
|
|
|
|
|
|
- |
|
| Non-Cash Changes: |
|
|
|
|
|
|
|
|
|
|
|
|
|
|
|
|
|
|
|
|
|
|
|
|
|
|
|
|
| Dividends Declared |
|
|
- |
|
|
|
|
|
|
|
41 |
|
|
|
|
|
|
|
- |
|
|
|
|
|
|
|
- |
|
| Unrealized Foreign Exchange (Gain) Loss (Note 5) |
|
|
- |
|
|
|
|
|
|
|
- |
|
|
|
|
|
|
|
- |
|
|
|
|
|
|
|
(413 |
) |
| Other |
|
|
8 |
|
|
|
|
|
|
|
- |
|
|
|
|
|
|
|
- |
|
|
|
|
|
|
|
1 |
|
| As at March 31, 2016 |
|
|
84 |
|
|
|
|
|
|
|
- |
|
|
|
|
|
|
|
- |
|
|
|
|
|
|
|
6,113 |
|
|
|
|
|
|
|
|
|
|
|
|
|
|
|
|
|
|
|
|
|
|
|
|
|
|
|
|
|
|
| As at December 31, 2016 |
|
|
56 |
|
|
|
|
|
|
|
- |
|
|
|
|
|
|
|
- |
|
|
|
|
|
|
|
6,332 |
|
| Changes From Financing Cash Flows: |
|
|
|
|
|
|
|
|
|
|
|
|
|
|
|
|
|
|
|
|
|
|
|
|
|
|
|
|
| Dividends Paid |
|
|
- |
|
|
|
|
|
|
|
(41 |
) |
|
|
|
|
|
|
- |
|
|
|
|
|
|
|
- |
|
| Acquisition Financing Costs |
|
|
10 |
|
|
|
|
|
|
|
- |
|
|
|
|
|
|
|
- |
|
|
|
|
|
|
|
- |
|
| Non-Cash Changes: |
|
|
|
|
|
|
|
|
|
|
|
|
|
|
|
|
|
|
|
|
|
|
|
|
|
|
|
|
| Dividends Declared |
|
|
- |
|
|
|
|
|
|
|
41 |
|
|
|
|
|
|
|
- |
|
|
|
|
|
|
|
- |
|
| Unrealized Foreign Exchange (Gain) Loss (Note 5) |
|
|
- |
|
|
|
|
|
|
|
- |
|
|
|
|
|
|
|
- |
|
|
|
|
|
|
|
(56 |
) |
| Other |
|
|
(2 |
) |
|
|
|
|
|
|
- |
|
|
|
|
|
|
|
- |
|
|
|
|
|
|
|
1 |
|
| As at March 31, 2017 |
|
|
64 |
|
|
|
|
|
|
|
- |
|
|
|
|
|
|
|
- |
|
|
|
|
|
|
|
6,277 |
|
23. COMMITMENTS AND CONTINGENCIES
A) Commitments
Cenovus has entered into various commitments in the normal course of operations primarily related to demand charges on firm transportation agreements. In
addition, the Company has commitments related to its risk management program and an obligation to fund its defined benefit pension and other post-employment benefit plans. Additional information related to the Company’s commitments can be found
in the notes to the annual Consolidated Financial Statements for the year ended December 31, 2016.
During the three months ended March 31,
2017, the Company’s transportation commitments decreased approximately $3.1 billion primarily due to the Company’s withdrawal from certain transportation initiatives. Transportation commitments include $16 billion that are
subject to regulatory approval or have been approved but are not yet in service (December 31, 2016 – $19 billion). These agreements are for terms up to 20 years subsequent to the date of commencement. As at March 31, 2017, total
transportation commitments were $23.2 billion.
|
|
|
| Cenovus Energy Inc. First Quarter 2017 Report |
|
Page 61 Notes to
Consolidated Financial Statements |
NOTES TO CONSOLIDATED FINANCIAL STATEMENTS (unaudited)
All amounts in $ millions, unless otherwise indicated
For the period ended March 31, 2017
As at March 31, 2017, there were outstanding letters of credit aggregating $254 million issued
as security for performance under certain contracts (December 31, 2016 – $258 million).
B) Legal Proceedings
Cenovus is involved in a limited number of legal claims associated with the normal course of operations. Cenovus believes that any
liabilities that might arise from such matters, to the extent not provided for, are not likely to have a material effect on its Consolidated Financial Statements.
24. SUBSEQUENT EVENT
Transformational Acquisition of Oil Sands Assets and Deep Basin Assets
On March 29, 2017, Cenovus entered into a purchase and sale agreement to acquire ConocoPhillips’ 50 percent interest in FCCL which would
increase Cenovus’s interest to 100 percent. In addition, Cenovus will acquire the majority of ConocoPhillips’ western Canadian conventional crude oil and natural gas assets, including undeveloped land, exploration and production
assets and related infrastructure and agreements in Alberta and British Columbia.
Total consideration for the Acquisition, as announced on
March 29, 2017, was $17.7 billion consisting of approximately US$10.6 billion in cash and 208 million Cenovus common shares. As part of the agreement, Cenovus has agreed to make quarterly payments to ConocoPhillips during the
five years subsequent to the closing date for quarters in which the average WCS crude oil price exceeds $52.00 per barrel during the quarter. The quarterly payment will be $6 million for each dollar that the WCS price exceeds $52.00 per barrel.
The calculation includes an adjustment mechanism related to certain significant production outages at Foster Creek and Christina Lake which may reduce the amount of a contingent payment. There are no maximum payment terms. The terms of the
contingent payment agreement allow Cenovus to retain 80 percent to 85 percent of the WCS prices above $52.00 per barrel, based on current gross production capacity at Foster Creek and Christina Lake. As production capacity increases with
future expansions, the percentage of upside available to Cenovus will increase further.
The Acquisition, which is subject to customary closing
conditions and regulatory approvals, will have an effective date of January 1, 2017 and is expected to close in the second quarter of 2017. As at March 31, 2017, Cenovus has paid a deposit of US$129.5 million which will be
applied against the Acquisition purchase price at the date of closing. Cenovus anticipates the majority of the purchase price will be allocated to acquired PP&E, E&E assets and goodwill.
To finance the cash portion of the purchase price, Cenovus completed a bought-deal common share financing and an offering in the United States for senior
unsecured notes. In addition, at close of the Acquisition, Cenovus expects to borrow $3.6 billion under a committed asset sale bridge credit facility. It is anticipated that the remainder of the purchase price will be funded by the
Company’s existing committed credit facility and cash on hand.
On March 29, 2017, Cenovus entered into an agreement, on a bought-deal
basis, with a syndicate of underwriters for an offering of 187.5 million common shares at a price of $16.00 per share for gross proceeds of $3.0 billion. The offering closed on April 6, 2017.
On April 7, 2017, Cenovus completed an offering in the United States for US$2.9 billion in senior unsecured notes in three series –
US$1.2 billion 4.25 percent senior notes due April 2027, US$700 million 5.25 percent senior notes due June 2037 and US$1.0 billion 5.40 percent senior notes due June 2047. These funds were placed into escrow subject to
closing of the Acquisition.
The committed asset sale bridge credit facility consists of three tranches which mature 12 months, 18 months and 24
months, respectively, following the Acquisition closing date. Cenovus expects to repay the committed asset sale bridge credit facility through the sale of certain assets. Concurrent with the announcement of the Acquisition, Cenovus commenced
marketing for sale certain non-core properties to help fund the Acquisition. The Company plans to divest of its Pelican Lake heavy oil assets, including the adjacent Grand Rapids project in the Greater Pelican
Lake region, and its Suffield crude oil and natural gas assets. These assets were reclassified as held for sale as at March 31, 2017.
Before
giving effect to the Acquisition, Cenovus, through a wholly owned subsidiary, was the managing partner and jointly owned 50 percent of FCCL. FCCL met the definition of a joint operation under IFRS 11, “Joint Arrangements” and
as such Cenovus recognized its share of the assets, liabilities, revenues and expenses in its consolidated results before the business combination. Upon completion of the Acquisition, Cenovus will control FCCL, as defined under IFRS 10,
“Consolidated Financial Statements” and accordingly FCCL will be consolidated. Upon closing, the Acquisition will be accounted for using the acquisition method pursuant to IFRS 3, “Business Combinations”
(“IFRS 3”). As required by IFRS 3, when an acquirer achieves control in stages, the previously held interest is re-measured to fair value at the acquisition date with any gain or loss
recognized in net earnings. At the closing date of the Acquisition, Cenovus expects to record a non-cash revaluation gain on the re-measurement to fair value of its
existing interest in FCCL.
|
|
|
| Cenovus Energy Inc. First Quarter 2017 Report |
|
Page 62 Notes to
Consolidated Financial Statements |
SUPPLEMENTAL INFORMATION (unaudited)
Financial Statistics
($ millions, except per share
amounts)
|
|
|
|
|
|
|
|
|
|
|
|
|
|
|
|
|
|
|
|
|
|
|
|
|
|
|
| Revenues |
|
2017 |
|
|
|
|
2016 |
|
| |
|
Q1 |
|
|
|
|
Year |
|
|
Q4 |
|
|
Q3 |
|
|
Q2 |
|
|
Q1 |
|
| Gross Sales |
|
|
|
|
|
|
|
|
|
|
|
|
|
|
|
|
|
|
|
|
|
|
|
|
|
|
| Upstream |
|
|
1,436 |
|
|
|
|
|
4,196 |
|
|
|
1,326 |
|
|
|
1,123 |
|
|
|
1,003 |
|
|
|
744 |
|
| Refining and Marketing |
|
|
2,604 |
|
|
|
|
|
8,439 |
|
|
|
2,477 |
|
|
|
2,245 |
|
|
|
2,129 |
|
|
|
1,588 |
|
| Corporate and Eliminations |
|
|
(98 |
) |
|
|
|
|
(353 |
) |
|
|
(108 |
) |
|
|
(89 |
) |
|
|
(89 |
) |
|
|
(67 |
) |
| Less: Royalties |
|
|
77 |
|
|
|
|
|
148 |
|
|
|
53 |
|
|
|
39 |
|
|
|
36 |
|
|
|
20 |
|
| Revenues |
|
|
3,865 |
|
|
|
|
|
12,134 |
|
|
|
3,642 |
|
|
|
3,240 |
|
|
|
3,007 |
|
|
|
2,245 |
|
|
|
|
|
| Operating Margin (1) |
|
2017 |
|
|
|
|
2016 |
|
| |
|
Q1 |
|
|
|
|
Year |
|
|
Q4 |
|
|
Q3 |
|
|
Q2 |
|
|
Q1 |
|
| Crude Oil and Natural Gas Liquids |
|
|
|
|
|
|
|
|
|
|
|
|
|
|
|
|
|
|
|
|
|
|
|
|
|
|
| Foster Creek |
|
|
101 |
|
|
|
|
|
399 |
|
|
|
165 |
|
|
|
125 |
|
|
|
98 |
|
|
|
11 |
|
| Christina Lake |
|
|
148 |
|
|
|
|
|
476 |
|
|
|
168 |
|
|
|
140 |
|
|
|
134 |
|
|
|
34 |
|
| Conventional |
|
|
100 |
|
|
|
|
|
402 |
|
|
|
100 |
|
|
|
108 |
|
|
|
106 |
|
|
|
88 |
|
| Natural Gas |
|
|
45 |
|
|
|
|
|
141 |
|
|
|
50 |
|
|
|
47 |
|
|
|
10 |
|
|
|
34 |
|
| Other Upstream Operations |
|
|
3 |
|
|
|
|
|
3 |
|
|
|
4 |
|
|
|
(1 |
) |
|
|
- |
|
|
|
- |
|
|
|
|
397 |
|
|
|
|
|
1,421 |
|
|
|
487 |
|
|
|
419 |
|
|
|
348 |
|
|
|
167 |
|
| Refining and Marketing |
|
|
53 |
|
|
|
|
|
346 |
|
|
|
108 |
|
|
|
68 |
|
|
|
193 |
|
|
|
(23 |
) |
| Operating Margin |
|
|
450 |
|
|
|
|
|
1,767 |
|
|
|
595 |
|
|
|
487 |
|
|
|
541 |
|
|
|
144 |
|
|
|
|
|
| Adjusted Funds Flow (2) |
|
2017 |
|
|
|
|
2016 |
|
| |
|
Q1 |
|
|
|
|
Year |
|
|
Q4 |
|
|
Q3 |
|
|
Q2 |
|
|
Q1 |
|
| Cash From Operating Activities |
|
|
328 |
|
|
|
|
|
861 |
|
|
|
164 |
|
|
|
310 |
|
|
|
205 |
|
|
|
182 |
|
| Deduct (Add Back): |
|
|
|
|
|
|
|
|
|
|
|
|
|
|
|
|
|
|
|
|
|
|
|
|
|
|
| Net Change in Other Assets and Liabilities |
|
|
(31 |
) |
|
|
|
|
(91 |
) |
|
|
(32 |
) |
|
|
(13 |
) |
|
|
(17 |
) |
|
|
(29 |
) |
| Net Change in Non-Cash
Working Capital |
|
|
36 |
|
|
|
|
|
(471 |
) |
|
|
(339 |
) |
|
|
(99 |
) |
|
|
(218 |
) |
|
|
185 |
|
| Adjusted Funds Flow |
|
|
323 |
|
|
|
|
|
1,423 |
|
|
|
535 |
|
|
|
422 |
|
|
|
440 |
|
|
|
26 |
|
| Per Share - Basic |
|
|
0.39 |
|
|
|
|
|
1.71 |
|
|
|
0.64 |
|
|
|
0.51 |
|
|
|
0.53 |
|
|
|
0.03 |
|
|
-
Diluted |
|
|
0.39 |
|
|
|
|
|
1.71 |
|
|
|
0.64 |
|
|
|
0.51 |
|
|
|
0.53 |
|
|
|
0.03 |
|
|
|
|
|
| Earnings |
|
2017 |
|
|
|
|
2016 |
|
| |
|
Q1 |
|
|
|
|
Year |
|
|
Q4 |
|
|
Q3 |
|
|
Q2 |
|
|
Q1 |
|
| Operating Earnings (Loss) (3) |
|
|
(39 |
) |
|
|
|
|
(377 |
) |
|
|
321 |
|
|
|
(236 |
) |
|
|
(39 |
) |
|
|
(423 |
) |
| Per Share - Diluted |
|
|
(0.05 |
) |
|
|
|
|
(0.45 |
) |
|
|
0.39 |
|
|
|
(0.28 |
) |
|
|
(0.05 |
) |
|
|
(0.51 |
) |
|
|
|
|
|
|
|
|
| Net Earnings (Loss) |
|
|
211 |
|
|
|
|
|
(545 |
) |
|
|
91 |
|
|
|
(251 |
) |
|
|
(267 |
) |
|
|
(118 |
) |
| Per Share - Basic and Diluted |
|
|
0.25 |
|
|
|
|
|
(0.65 |
) |
|
|
0.11 |
|
|
|
(0.30 |
) |
|
|
(0.32 |
) |
|
|
(0.14 |
) |
|
|
|
|
| Income Tax & Exchange Rates |
|
2017 |
|
|
|
|
2016 |
|
| |
|
Q1 |
|
|
|
|
Year |
|
|
Q4 |
|
|
Q3 |
|
|
Q2 |
|
|
Q1 |
|
| Effective Tax Rates Using: |
|
|
|
|
|
|
|
|
|
|
|
|
|
|
|
|
|
|
|
|
|
|
|
|
|
|
| Net Earnings |
|
|
18.8 |
% |
|
|
|
|
41.2 |
% |
|
|
|
|
|
|
|
|
|
|
|
|
|
|
|
|
| Operating Earnings, Excluding Divestitures |
|
|
47.3 |
% |
|
|
|
|
33.0 |
% |
|
|
|
|
|
|
|
|
|
|
|
|
|
|
|
|
| Canadian Statutory Rate |
|
|
27.0 |
% |
|
|
|
|
27.0 |
% |
|
|
|
|
|
|
|
|
|
|
|
|
|
|
|
|
| U.S. Statutory Rate |
|
|
38.0 |
% |
|
|
|
|
38.0 |
% |
|
|
|
|
|
|
|
|
|
|
|
|
|
|
|
|
|
|
|
|
|
|
|
|
| Foreign Exchange Rates (US$ per C$1) |
|
|
|
|
|
|
|
|
|
|
|
|
|
|
|
|
|
|
|
|
|
|
|
|
|
|
| Average |
|
|
0.756 |
|
|
|
|
|
0.755 |
|
|
|
0.750 |
|
|
|
0.766 |
|
|
|
0.776 |
|
|
|
0.728 |
|
| Period End |
|
|
0.751 |
|
|
|
|
|
0.745 |
|
|
|
0.745 |
|
|
|
0.762 |
|
|
|
0.769 |
|
|
|
0.771 |
|
| (1) Operating Margin is an
additional subtotal found in Note 1 of the Consolidated Financial Statements and is used to provide a consistent measure of the cash generating performance of our assets for comparability of our underlying financial performance between periods.
Operating Margin is defined as revenues less purchased product, transportation and blending, operating expenses, production and mineral taxes plus realized gains less realized losses on risk management activities. Items within the Corporate and
Eliminations segment are excluded from the calculation of Operating Margin.
(2) Adjusted Funds Flow is a
non-GAAP measure commonly used in the oil and gas industry to assist in measuring a company’s ability to finance its capital programs and meet its financial obligations. Adjusted Funds Flow is defined as
Cash From Operating Activities excluding net change in other assets and liabilities and net change in non-cash working capital. Net change in other assets and liabilities is composed of site restoration costs
and pension funding. Non-cash working capital is composed of current assets and current liabilities, excluding cash and cash equivalents and risk management.
(3) Operating Earnings (Loss) is a non-GAAP measure used to provide a consistent measure of the comparability of our underlying financial performance between periods by removing non-operating items. Operating
Earnings (Loss) is defined as Earnings (Loss) Before Income Tax excluding gain (loss) on discontinuance, gain on bargain purchase, unrealized risk management gains (losses) on derivative instruments, unrealized foreign exchange gains (losses) on
translation of U.S. dollar denominated notes issued from Canada, foreign exchange gains (losses) on settlement of intercompany transactions, gains (losses) on divestiture of assets, less income taxes on Operating Earnings (Loss) before tax,
excluding the effect of changes in statutory income tax rates and the recognition of an increase in U.S. tax basis. |
|
| Financial Metrics (Non-GAAP Measures) |
|
2017 |
|
|
|
|
2016 |
|
| |
|
Q1 |
|
|
|
|
Year |
|
|
Q4 |
|
|
Q3 |
|
|
Q2 |
|
|
Q1 |
|
| Net Debt to Capitalization (1) (2) |
|
|
19% |
|
|
|
|
|
18% |
|
|
|
18% |
|
|
|
17% |
|
|
|
17% |
|
|
|
16% |
|
| Debt to Capitalization (3) (4) |
|
|
35% |
|
|
|
|
|
35% |
|
|
|
35% |
|
|
|
35% |
|
|
|
34% |
|
|
|
34% |
|
| Net Debt to Adjusted EBITDA (1) (5) |
|
|
1.6x |
|
|
|
|
|
1.9x |
|
|
|
1.9x |
|
|
|
2.0x |
|
|
|
1.9x |
|
|
|
1.3x |
|
| Debt to Adjusted EBITDA (3) (5) |
|
|
3.7x |
|
|
|
|
|
4.5x |
|
|
|
4.5x |
|
|
|
5.3x |
|
|
|
4.8x |
|
|
|
3.6x |
|
| Return on Capital Employed (6) |
|
|
0% |
|
|
|
|
|
(2)% |
|
|
|
(2)% |
|
|
|
(6)% |
|
|
|
6% |
|
|
|
8% |
|
| Return on Common Equity (7) |
|
|
(2)% |
|
|
|
|
|
(5)% |
|
|
|
(5)% |
|
|
|
(10)% |
|
|
|
7% |
|
|
|
10% |
|
| (1) |
Net debt includes the Company’s short-term borrowings, and the current and long-term portions of long-term debt, net
of cash and cash equivalents. |
| (2) |
Net debt to capitalization is defined as net debt divided by net debt plus shareholders’ equity.
|
| (3) |
Debt includes the Company’s short-term borrowings and the current and long-term portions of long-term debt.
|
| (4) |
Capitalization is a non-GAAP measure defined as debt plus shareholders’
equity. |
| (5) |
Adjusted EBITDA is defined as earnings before finance costs, interest income, income tax expense, depreciation, depletion
and amortization, goodwill impairments, asset impairments and reversals, unrealized gains (losses) on risk management, foreign exchange gains (losses), gains (losses) on divestiture of assets and other income (loss), net, calculated on a trailing
twelve-month basis. |
| (6) |
Return on capital employed is calculated, on a trailing twelve-month basis, as net earnings before after-tax interest divided by average shareholders’ equity plus average debt. |
| (7) |
Return on common equity is calculated, on a trailing twelve-month basis, as net earnings divided by average
shareholders’ equity. |
|
|
|
| Cenovus Energy Inc. First Quarter 2017 Report |
|
Page 63 Supplemental
Information |
SUPPLEMENTAL INFORMATION (unaudited)
Financial Statistics (continued)
|
|
|
|
|
|
|
|
|
|
|
|
|
|
|
|
|
|
|
|
|
|
|
|
|
|
|
|
|
| Common Share Information |
|
2017 |
|
|
|
|
|
2016 |
|
| |
|
Q1 |
|
|
|
|
|
Year |
|
|
Q4 |
|
|
Q3 |
|
|
Q2 |
|
|
Q1 |
|
| Common Shares Outstanding (millions) |
|
|
|
|
|
|
|
|
|
|
|
|
|
|
|
|
|
|
|
|
|
|
|
|
|
|
|
|
| Period End (1) |
|
|
833.3 |
|
|
|
|
|
|
|
833.3 |
|
|
|
833.3 |
|
|
|
833.3 |
|
|
|
833.3 |
|
|
|
833.3 |
|
| Average - Basic and Diluted |
|
|
833.3 |
|
|
|
|
|
|
|
833.3 |
|
|
|
833.3 |
|
|
|
833.3 |
|
|
|
833.3 |
|
|
|
833.3 |
|
|
|
|
|
|
|
|
|
| Price Range ($ per share) |
|
|
|
|
|
|
|
|
|
|
|
|
|
|
|
|
|
|
|
|
|
|
|
|
|
|
|
|
| TSX - C$ |
|
|
|
|
|
|
|
|
|
|
|
|
|
|
|
|
|
|
|
|
|
|
|
|
|
|
|
|
| High |
|
|
20.88 |
|
|
|
|
|
|
|
22.07 |
|
|
|
22.07 |
|
|
|
20.06 |
|
|
|
21.00 |
|
|
|
18.15 |
|
| Low |
|
|
14.81 |
|
|
|
|
|
|
|
12.70 |
|
|
|
17.96 |
|
|
|
17.15 |
|
|
|
16.12 |
|
|
|
12.70 |
|
| Close |
|
|
15.05 |
|
|
|
|
|
|
|
20.30 |
|
|
|
20.30 |
|
|
|
18.83 |
|
|
|
17.87 |
|
|
|
16.90 |
|
| NYSE - US$ |
|
|
|
|
|
|
|
|
|
|
|
|
|
|
|
|
|
|
|
|
|
|
|
|
|
|
|
|
| High |
|
|
15.54 |
|
|
|
|
|
|
|
16.82 |
|
|
|
16.82 |
|
|
|
15.72 |
|
|
|
16.56 |
|
|
|
13.97 |
|
| Low |
|
|
11.12 |
|
|
|
|
|
|
|
9.10 |
|
|
|
13.36 |
|
|
|
12.93 |
|
|
|
12.25 |
|
|
|
9.10 |
|
| Close |
|
|
11.30 |
|
|
|
|
|
|
|
15.13 |
|
|
|
15.13 |
|
|
|
14.37 |
|
|
|
13.82 |
|
|
|
13.00 |
|
|
|
|
|
|
|
|
|
| Dividends ($ per share) |
|
|
0.05 |
|
|
|
|
|
|
|
0.20 |
|
|
|
0.05 |
|
|
|
0.05 |
|
|
|
0.05 |
|
|
|
0.05 |
|
|
|
|
|
|
|
|
|
| Share Volume Traded (millions) |
|
|
493.2 |
|
|
|
|
|
|
|
1,491.7 |
|
|
|
322.6 |
|
|
|
313.0 |
|
|
|
373.3 |
|
|
|
482.8 |
|
| (1) On April 6, 2017, Cenovus closed a bought-deal common share financing for 187.5 million common shares. |
|
|
|
|
|
|
|
|
|
|
|
|
|
|
|
|
|
| Net Capital Investment |
|
2017 |
|
|
|
|
|
2016 |
|
| |
|
Q1 |
|
|
|
|
|
Year |
|
|
Q4 |
|
|
Q3 |
|
|
Q2 |
|
|
Q1 |
|
| Capital Investment ($ millions) |
|
|
|
|
|
|
|
|
|
|
|
|
|
|
|
|
|
|
|
|
|
|
|
|
|
|
|
|
| Oil Sands |
|
|
|
|
|
|
|
|
|
|
|
|
|
|
|
|
|
|
|
|
|
|
|
|
|
|
|
|
| Foster Creek |
|
|
70 |
|
|
|
|
|
|
|
263 |
|
|
|
52 |
|
|
|
54 |
|
|
|
68 |
|
|
|
89 |
|
| Christina Lake |
|
|
63 |
|
|
|
|
|
|
|
282 |
|
|
|
60 |
|
|
|
47 |
|
|
|
61 |
|
|
|
114 |
|
| Total |
|
|
133 |
|
|
|
|
|
|
|
545 |
|
|
|
112 |
|
|
|
101 |
|
|
|
129 |
|
|
|
203 |
|
| Other Oil Sands |
|
|
39 |
|
|
|
|
|
|
|
59 |
|
|
|
16 |
|
|
|
9 |
|
|
|
10 |
|
|
|
24 |
|
|
|
|
172 |
|
|
|
|
|
|
|
604 |
|
|
|
128 |
|
|
|
110 |
|
|
|
139 |
|
|
|
227 |
|
| Conventional |
|
|
88 |
|
|
|
|
|
|
|
171 |
|
|
|
57 |
|
|
|
41 |
|
|
|
34 |
|
|
|
39 |
|
| Refining and Marketing |
|
|
46 |
|
|
|
|
|
|
|
220 |
|
|
|
64 |
|
|
|
51 |
|
|
|
53 |
|
|
|
52 |
|
| Corporate |
|
|
7 |
|
|
|
|
|
|
|
31 |
|
|
|
10 |
|
|
|
6 |
|
|
|
10 |
|
|
|
5 |
|
| Capital Investment |
|
|
313 |
|
|
|
|
|
|
|
1,026 |
|
|
|
259 |
|
|
|
208 |
|
|
|
236 |
|
|
|
323 |
|
| Acquisitions |
|
|
- |
|
|
|
|
|
|
|
11 |
|
|
|
- |
|
|
|
- |
|
|
|
11 |
|
|
|
- |
|
|
Divestitures |
|
|
- |
|
|
|
|
|
|
|
(8 |
) |
|
|
- |
|
|
|
(8 |
) |
|
|
- |
|
|
|
- |
|
| Net Acquisition and Divestiture Activity |
|
|
- |
|
|
|
|
|
|
|
3 |
|
|
|
- |
|
|
|
(8 |
) |
|
|
11 |
|
|
|
- |
|
| Net Capital Investment |
|
|
313 |
|
|
|
|
|
|
|
1,029 |
|
|
|
259 |
|
|
|
200 |
|
|
|
247 |
|
|
|
323 |
|
| Operating Statistics - Before Royalties |
|
|
|
|
|
|
|
|
|
|
|
|
|
|
|
|
|
| Upstream Production Volumes |
|
2017 |
|
|
|
|
|
2016 |
|
| |
|
Q1 |
|
|
|
|
|
Year |
|
|
Q4 |
|
|
Q3 |
|
|
Q2 |
|
|
Q1 |
|
| Crude Oil and Natural Gas Liquids (bbls/d) |
|
|
|
|
|
|
|
|
|
|
|
|
|
|
|
|
|
|
|
|
|
|
|
|
|
|
|
|
| Oil Sands |
|
|
|
|
|
|
|
|
|
|
|
|
|
|
|
|
|
|
|
|
|
|
|
|
|
|
|
|
| Foster Creek |
|
|
80,866 |
|
|
|
|
|
|
|
70,244 |
|
|
|
81,588 |
|
|
|
73,798 |
|
|
|
64,544 |
|
|
|
60,882 |
|
| Christina Lake |
|
|
100,635 |
|
|
|
|
|
|
|
79,449 |
|
|
|
82,808 |
|
|
|
79,793 |
|
|
|
78,060 |
|
|
|
77,093 |
|
|
|
|
181,501 |
|
|
|
|
|
|
|
149,693 |
|
|
|
164,396 |
|
|
|
153,591 |
|
|
|
142,604 |
|
|
|
137,975 |
|
| Conventional |
|
|
|
|
|
|
|
|
|
|
|
|
|
|
|
|
|
|
|
|
|
|
|
|
|
|
|
|
| Heavy Oil |
|
|
27,277 |
|
|
|
|
|
|
|
29,185 |
|
|
|
28,913 |
|
|
|
28,096 |
|
|
|
28,500 |
|
|
|
31,247 |
|
| Light and Medium Oil |
|
|
25,089 |
|
|
|
|
|
|
|
25,915 |
|
|
|
25,065 |
|
|
|
25,311 |
|
|
|
26,177 |
|
|
|
27,121 |
|
| Natural Gas Liquids
(1) |
|
|
1,047 |
|
|
|
|
|
|
|
1,065 |
|
|
|
1,177 |
|
|
|
1,074 |
|
|
|
799 |
|
|
|
1,208 |
|
| |
|
|
53,413 |
|
|
|
|
|
|
|
56,165 |
|
|
|
55,155 |
|
|
|
54,481 |
|
|
|
55,476 |
|
|
|
59,576 |
|
| Total Crude Oil and Natural Gas Liquids |
|
|
234,914 |
|
|
|
|
|
|
|
205,858 |
|
|
|
219,551 |
|
|
|
208,072 |
|
|
|
198,080 |
|
|
|
197,551 |
|
| Natural Gas (MMcf/d) |
|
|
|
|
|
|
|
|
|
|
|
|
|
|
|
|
|
|
|
|
|
|
|
|
|
|
|
|
| Oil Sands |
|
|
15 |
|
|
|
|
|
|
|
17 |
|
|
|
17 |
|
|
|
18 |
|
|
|
18 |
|
|
|
17 |
|
| Conventional |
|
|
348 |
|
|
|
|
|
|
|
377 |
|
|
|
362 |
|
|
|
374 |
|
|
|
381 |
|
|
|
391 |
|
| Total Natural Gas |
|
|
363 |
|
|
|
|
|
|
|
394 |
|
|
|
379 |
|
|
|
392 |
|
|
|
399 |
|
|
|
408 |
|
| Total Production (2) (BOE/d) |
|
|
295,414 |
|
|
|
|
|
|
|
271,525 |
|
|
|
282,718 |
|
|
|
273,405 |
|
|
|
264,580 |
|
|
|
265,551 |
|
|
|
|
|
| Upstream Sales Volumes |
|
2017 |
|
|
|
|
|
2016 |
|
| |
|
Q1 |
|
|
|
|
|
Year |
|
|
Q4 |
|
|
Q3 |
|
|
Q2 |
|
|
Q1 |
|
| Crude Oil and Natural Gas Liquids (bbls/d) |
|
|
|
|
|
|
|
|
|
|
|
|
|
|
|
|
|
|
|
|
|
|
|
|
|
|
|
|
| Oil Sands |
|
|
|
|
|
|
|
|
|
|
|
|
|
|
|
|
|
|
|
|
|
|
|
|
|
|
|
|
| Foster Creek |
|
|
78,562 |
|
|
|
|
|
|
|
69,647 |
|
|
|
79,827 |
|
|
|
76,318 |
|
|
|
62,089 |
|
|
|
60,169 |
|
| Christina Lake |
|
|
89,919 |
|
|
|
|
|
|
|
79,481 |
|
|
|
81,398 |
|
|
|
80,313 |
|
|
|
76,066 |
|
|
|
80,118 |
|
|
|
|
168,481 |
|
|
|
|
|
|
|
149,128 |
|
|
|
161,225 |
|
|
|
156,631 |
|
|
|
138,155 |
|
|
|
140,287 |
|
| Conventional |
|
|
|
|
|
|
|
|
|
|
|
|
|
|
|
|
|
|
|
|
|
|
|
|
|
|
|
|
| Heavy Oil |
|
|
26,222 |
|
|
|
|
|
|
|
28,958 |
|
|
|
28,833 |
|
|
|
27,953 |
|
|
|
28,294 |
|
|
|
30,764 |
|
| Light and Medium Oil |
|
|
25,074 |
|
|
|
|
|
|
|
25,965 |
|
|
|
24,903 |
|
|
|
25,359 |
|
|
|
26,407 |
|
|
|
27,210 |
|
| Natural Gas Liquids
(1) |
|
|
1,047 |
|
|
|
|
|
|
|
1,065 |
|
|
|
1,177 |
|
|
|
1,074 |
|
|
|
799 |
|
|
|
1,208 |
|
| |
|
|
52,343 |
|
|
|
|
|
|
|
55,988 |
|
|
|
54,913 |
|
|
|
54,386 |
|
|
|
55,500 |
|
|
|
59,182 |
|
| Total Crude Oil and Natural Gas Liquids |
|
|
220,824 |
|
|
|
|
|
|
|
205,116 |
|
|
|
216,138 |
|
|
|
211,017 |
|
|
|
193,655 |
|
|
|
199,469 |
|
| Natural Gas (MMcf/d) |
|
|
|
|
|
|
|
|
|
|
|
|
|
|
|
|
|
|
|
|
|
|
|
|
|
|
|
|
| Oil Sands |
|
|
15 |
|
|
|
|
|
|
|
17 |
|
|
|
17 |
|
|
|
18 |
|
|
|
18 |
|
|
|
17 |
|
| Conventional |
|
|
348 |
|
|
|
|
|
|
|
377 |
|
|
|
362 |
|
|
|
374 |
|
|
|
381 |
|
|
|
391 |
|
| Total Natural Gas |
|
|
363 |
|
|
|
|
|
|
|
394 |
|
|
|
379 |
|
|
|
392 |
|
|
|
399 |
|
|
|
408 |
|
| Total Sales
(2) (BOE/d) |
|
|
281,324 |
|
|
|
|
|
|
|
270,783 |
|
|
|
279,305 |
|
|
|
276,350 |
|
|
|
260,155 |
|
|
|
267,469 |
|
| (1) Natural
gas liquids include condensate volumes.
(2) Natural gas volumes have been converted
to barrels of oil equivalent (“BOE”) on the basis of six thousand cubic feet (“Mcf”) to one barrel (“bbl”). BOE may be misleading, particularly if used in isolation. A conversion ratio of one bbl to six Mcf is based on
an energy equivalency conversion method primarily applicable at the burner tip and does not represent value equivalency at the wellhead. Given that the value ratio based on the current price of crude oil compared to natural gas is significantly
different from the energy equivalency conversion ratio of 6:1, utilizing a conversion on a 6:1 basis is not an accurate reflection of value. |
|
|
|
|
|
| Average Royalty Rates |
|
|
|
|
|
|
|
|
|
| (Excluding Impact of Realized Gain (Loss) on Risk Management) |
|
2017 |
|
|
|
|
|
2016 |
|
| |
|
Q1 |
|
|
|
|
|
Year |
|
|
Q4 |
|
|
Q3 |
|
|
Q2 |
|
|
Q1 |
|
| Oil Sands |
|
|
|
|
|
|
|
|
|
|
|
|
|
|
|
|
|
|
|
|
|
|
|
|
|
|
|
|
| Foster Creek |
|
|
8.5 |
% |
|
|
|
|
|
|
0.0 |
% |
|
|
(0.9 |
)% |
|
|
0.8 |
% |
|
|
1.0 |
% |
|
|
(4.9 |
)% |
| Christina Lake |
|
|
2.7 |
% |
|
|
|
|
|
|
1.6 |
% |
|
|
1.8 |
% |
|
|
1.6 |
% |
|
|
1.2 |
% |
|
|
1.2 |
% |
| Conventional Oil |
|
|
|
|
|
|
|
|
|
|
|
|
|
|
|
|
|
|
|
|
|
|
|
|
|
|
|
|
| Pelican Lake |
|
|
19.8 |
% |
|
|
|
|
|
|
12.5 |
% |
|
|
11.9 |
% |
|
|
14.1 |
% |
|
|
14.3 |
% |
|
|
8.3 |
% |
| Weyburn |
|
|
28.3 |
% |
|
|
|
|
|
|
23.6 |
% |
|
|
28.3 |
% |
|
|
23.0 |
% |
|
|
23.9 |
% |
|
|
16.6 |
% |
| Other |
|
|
12.4 |
% |
|
|
|
|
|
|
12.8 |
% |
|
|
19.3 |
% |
|
|
10.4 |
% |
|
|
8.6 |
% |
|
|
12.0 |
% |
| Natural Gas Liquids |
|
|
13.3 |
% |
|
|
|
|
|
|
13.5 |
% |
|
|
12.2 |
% |
|
|
12.0 |
% |
|
|
15.0 |
% |
|
|
16.1 |
% |
| Natural Gas |
|
|
4.8 |
% |
|
|
|
|
|
|
4.6 |
% |
|
|
5.3 |
% |
|
|
4.5 |
% |
|
|
3.7 |
% |
|
|
4.3 |
% |
|
|
|
|
| Refining |
|
2017 |
|
|
|
|
|
2016 |
|
| |
|
Q1 |
|
|
|
|
|
Year |
|
|
Q4 |
|
|
Q3 |
|
|
Q2 |
|
|
Q1 |
|
| Refinery Operations (1) |
|
|
|
|
|
|
|
|
|
|
|
|
|
|
|
|
|
|
|
|
|
|
|
|
|
|
|
|
| Crude Oil Capacity (Mbbls/d) |
|
|
460 |
|
|
|
|
|
|
|
460 |
|
|
|
460 |
|
|
|
460 |
|
|
|
460 |
|
|
|
460 |
|
| Crude Oil Runs (Mbbls/d) |
|
|
406 |
|
|
|
|
|
|
|
444 |
|
|
|
421 |
|
|
|
463 |
|
|
|
458 |
|
|
|
435 |
|
| Heavy Oil |
|
|
200 |
|
|
|
|
|
|
|
233 |
|
|
|
223 |
|
|
|
241 |
|
|
|
228 |
|
|
|
241 |
|
| Light/Medium |
|
|
206 |
|
|
|
|
|
|
|
211 |
|
|
|
198 |
|
|
|
222 |
|
|
|
230 |
|
|
|
194 |
|
| Crude Utilization |
|
|
88 |
% |
|
|
|
|
|
|
97 |
% |
|
|
92 |
% |
|
|
101 |
% |
|
|
100 |
% |
|
|
95 |
% |
| Refined Products (Mbbls/d) |
|
|
433 |
|
|
|
|
|
|
|
471 |
|
|
|
448 |
|
|
|
494 |
|
|
|
483 |
|
|
|
460 |
|
| (1) |
Represents 100% of the Wood River and Borger refinery operations. |
|
|
|
| Cenovus Energy Inc. First Quarter 2017 Report |
|
Page 64 Supplemental
Information |
SUPPLEMENTAL INFORMATION (unaudited)
Operating Statistics - Before Royalties (continued)
|
|
|
|
|
|
|
|
|
|
|
|
|
|
|
|
|
|
|
|
|
|
|
|
|
|
|
|
|
| Selected Average Benchmark Prices |
|
2017 |
|
|
|
|
|
2016 |
|
| |
|
Q1 |
|
|
|
|
|
Year |
|
|
Q4 |
|
|
Q3 |
|
|
Q2 |
|
|
Q1 |
|
| Crude Oil Prices
(US$/bbl) |
|
|
|
|
|
|
|
|
|
|
|
|
|
|
|
|
|
|
|
|
|
|
|
|
|
|
|
|
| Brent |
|
|
54.66 |
|
|
|
|
|
|
|
45.04 |
|
|
|
51.13 |
|
|
|
46.98 |
|
|
|
46.97 |
|
|
|
35.08 |
|
| West Texas Intermediate (“WTI”) |
|
|
51.91 |
|
|
|
|
|
|
|
43.32 |
|
|
|
49.29 |
|
|
|
44.94 |
|
|
|
45.59 |
|
|
|
33.45 |
|
| Differential Brent - WTI |
|
|
2.75 |
|
|
|
|
|
|
|
1.72 |
|
|
|
1.84 |
|
|
|
2.04 |
|
|
|
1.38 |
|
|
|
1.63 |
|
| Western Canadian Select (“WCS”) |
|
|
37.33 |
|
|
|
|
|
|
|
29.48 |
|
|
|
34.97 |
|
|
|
31.44 |
|
|
|
32.29 |
|
|
|
19.21 |
|
| WCS (C$) |
|
|
49.38 |
|
|
|
|
|
|
|
39.05 |
|
|
|
46.63 |
|
|
|
41.04 |
|
|
|
41.61 |
|
|
|
26.39 |
|
| Differential WTI - WCS |
|
|
14.58 |
|
|
|
|
|
|
|
13.84 |
|
|
|
14.32 |
|
|
|
13.50 |
|
|
|
13.30 |
|
|
|
14.24 |
|
| Condensate (C5 @ Edmonton) |
|
|
52.26 |
|
|
|
|
|
|
|
42.47 |
|
|
|
48.33 |
|
|
|
43.07 |
|
|
|
44.07 |
|
|
|
34.39 |
|
| Differential WTI - Condensate (Premium)/Discount |
|
|
(0.35 |
) |
|
|
|
|
|
|
0.85 |
|
|
|
0.96 |
|
|
|
1.87 |
|
|
|
1.52 |
|
|
|
(0.94 |
) |
| Refining Margins 3-2-1
Crack Spreads (1) (US$/bbl) |
|
|
|
|
|
|
|
|
|
|
|
|
|
|
|
|
|
|
|
|
|
|
|
|
|
|
|
|
| Chicago |
|
|
11.54 |
|
|
|
|
|
|
|
13.07 |
|
|
|
10.96 |
|
|
|
14.58 |
|
|
|
17.15 |
|
|
|
9.58 |
|
| Group 3 |
|
|
13.18 |
|
|
|
|
|
|
|
12.27 |
|
|
|
10.95 |
|
|
|
14.56 |
|
|
|
13.03 |
|
|
|
10.52 |
|
| Natural Gas Prices |
|
|
|
|
|
|
|
|
|
|
|
|
|
|
|
|
|
|
|
|
|
|
|
|
|
|
|
|
| AECO (C$/Mcf) |
|
|
2.94 |
|
|
|
|
|
|
|
2.09 |
|
|
|
2.81 |
|
|
|
2.20 |
|
|
|
1.25 |
|
|
|
2.11 |
|
| NYMEX (US$/Mcf) |
|
|
3.32 |
|
|
|
|
|
|
|
2.46 |
|
|
|
2.98 |
|
|
|
2.81 |
|
|
|
1.95 |
|
|
|
2.09 |
|
| Differential NYMEX - AECO (US$/Mcf) |
|
|
1.10 |
|
|
|
|
|
|
|
0.89 |
|
|
|
0.86 |
|
|
|
1.13 |
|
|
|
0.99 |
|
|
|
0.56 |
|
| (1) The 3-2-1 crack spread is an indicator of the refining margin generated by converting three barrels of crude oil into two barrels of regular unleaded gasoline and one barrel of ultra-low sulphur diesel using current month WTI based crude oil feedstock prices and on a last in, first out accounting basis (“LIFO”).
|
|
| Netbacks (1)
(Excluding Impact of Realized Gain (Loss) on Risk Management) |
|
2017 |
|
|
|
|
|
2016 |
|
| |
|
Q1 |
|
|
|
|
|
Year |
|
|
Q4 |
|
|
Q3 |
|
|
Q2 |
|
|
Q1 |
|
| Heavy Oil - Foster Creek ($/bbl) |
|
|
|
|
|
|
|
|
|
|
|
|
|
|
|
|
|
|
|
|
|
|
|
|
|
|
|
|
| Sales Price |
|
|
40.62 |
|
|
|
|
|
|
|
30.32 |
|
|
|
38.59 |
|
|
|
33.61 |
|
|
|
33.40 |
|
|
|
11.82 |
|
| Royalties |
|
|
2.83 |
|
|
|
|
|
|
|
(0.01 |
) |
|
|
(0.27 |
) |
|
|
0.19 |
|
|
|
0.23 |
|
|
|
(0.16 |
) |
| Transportation and Blending |
|
|
7.72 |
|
|
|
|
|
|
|
8.84 |
|
|
|
7.37 |
|
|
|
8.38 |
|
|
|
11.44 |
|
|
|
8.70 |
|
| Operating
|
|
|
9.99 |
|
|
|
|
|
|
|
10.55 |
|
|
|
10.60 |
|
|
|
9.63 |
|
|
|
10.15 |
|
|
|
12.05 |
|
| Netback |
|
|
20.08 |
|
|
|
|
|
|
|
10.94 |
|
|
|
20.89 |
|
|
|
15.41 |
|
|
|
11.58 |
|
|
|
(8.77 |
) |
| Heavy Oil - Christina Lake
($/bbl) |
|
|
|
|
|
|
|
|
|
|
|
|
|
|
|
|
|
|
|
|
|
|
|
|
|
|
|
|
| Sales Price |
|
|
35.86 |
|
|
|
|
|
|
|
25.30 |
|
|
|
34.78 |
|
|
|
29.11 |
|
|
|
28.31 |
|
|
|
8.85 |
|
| Royalties |
|
|
0.86 |
|
|
|
|
|
|
|
0.33 |
|
|
|
0.56 |
|
|
|
0.41 |
|
|
|
0.28 |
|
|
|
0.05 |
|
| Transportation and Blending |
|
|
4.13 |
|
|
|
|
|
|
|
4.68 |
|
|
|
4.08 |
|
|
|
4.49 |
|
|
|
4.90 |
|
|
|
5.28 |
|
| Operating
|
|
|
8.08 |
|
|
|
|
|
|
|
7.48 |
|
|
|
8.15 |
|
|
|
7.72 |
|
|
|
6.35 |
|
|
|
7.61 |
|
| Netback |
|
|
22.79 |
|
|
|
|
|
|
|
12.81 |
|
|
|
21.99 |
|
|
|
16.49 |
|
|
|
16.78 |
|
|
|
(4.09 |
) |
| Total Heavy Oil - Oil Sands
($/bbl) |
|
|
|
|
|
|
|
|
|
|
|
|
|
|
|
|
|
|
|
|
|
|
|
|
|
|
|
|
| Sales Price |
|
|
38.08 |
|
|
|
|
|
|
|
27.64 |
|
|
|
36.67 |
|
|
|
31.30 |
|
|
|
30.59 |
|
|
|
10.13 |
|
| Royalties |
|
|
1.78 |
|
|
|
|
|
|
|
0.17 |
|
|
|
0.14 |
|
|
|
0.30 |
|
|
|
0.26 |
|
|
|
(0.04 |
) |
| Transportation and Blending |
|
|
5.81 |
|
|
|
|
|
|
|
6.62 |
|
|
|
5.71 |
|
|
|
6.39 |
|
|
|
7.84 |
|
|
|
6.75 |
|
| Operating
|
|
|
8.97 |
|
|
|
|
|
|
|
8.91 |
|
|
|
9.37 |
|
|
|
8.65 |
|
|
|
8.06 |
|
|
|
9.52 |
|
| Netback |
|
|
21.52 |
|
|
|
|
|
|
|
11.94 |
|
|
|
21.45 |
|
|
|
15.96 |
|
|
|
14.43 |
|
|
|
(6.10 |
) |
| Heavy Oil - Conventional
($/bbl) |
|
|
|
|
|
|
|
|
|
|
|
|
|
|
|
|
|
|
|
|
|
|
|
|
|
|
|
|
| Sales Price |
|
|
47.77 |
|
|
|
|
|
|
|
35.82 |
|
|
|
40.72 |
|
|
|
40.50 |
|
|
|
36.77 |
|
|
|
25.99 |
|
| Royalties |
|
|
7.03 |
|
|
|
|
|
|
|
3.31 |
|
|
|
4.08 |
|
|
|
3.97 |
|
|
|
3.95 |
|
|
|
1.40 |
|
| Transportation and Blending |
|
|
3.40 |
|
|
|
|
|
|
|
4.60 |
|
|
|
4.90 |
|
|
|
4.86 |
|
|
|
3.85 |
|
|
|
4.77 |
|
| Operating |
|
|
12.86 |
|
|
|
|
|
|
|
13.38 |
|
|
|
14.69 |
|
|
|
12.43 |
|
|
|
12.34 |
|
|
|
13.98 |
|
| Production and Mineral Taxes |
|
|
0.02 |
|
|
|
|
|
|
|
0.01 |
|
|
|
0.01 |
|
|
|
0.01 |
|
|
|
0.01 |
|
|
|
- |
|
| Netback |
|
|
24.46 |
|
|
|
|
|
|
|
14.52 |
|
|
|
17.04 |
|
|
|
19.23 |
|
|
|
16.62 |
|
|
|
5.84 |
|
| Light and Medium Oil ($/bbl) |
|
|
|
|
|
|
|
|
|
|
|
|
|
|
|
|
|
|
|
|
|
|
|
|
|
|
|
|
| Sales Price |
|
|
56.84 |
|
|
|
|
|
|
|
46.48 |
|
|
|
55.35 |
|
|
|
48.97 |
|
|
|
48.09 |
|
|
|
34.36 |
|
| Royalties |
|
|
12.75 |
|
|
|
|
|
|
|
9.28 |
|
|
|
14.87 |
|
|
|
8.91 |
|
|
|
8.52 |
|
|
|
5.18 |
|
| Transportation and Blending |
|
|
2.70 |
|
|
|
|
|
|
|
2.73 |
|
|
|
2.69 |
|
|
|
2.71 |
|
|
|
2.77 |
|
|
|
2.73 |
|
| Operating |
|
|
16.77 |
|
|
|
|
|
|
|
15.65 |
|
|
|
16.05 |
|
|
|
13.94 |
|
|
|
16.21 |
|
|
|
16.34 |
|
| Production and Mineral Taxes |
|
|
1.95 |
|
|
|
|
|
|
|
1.24 |
|
|
|
1.50 |
|
|
|
1.48 |
|
|
|
1.18 |
|
|
|
0.82 |
|
| Netback |
|
|
22.67 |
|
|
|
|
|
|
|
17.58 |
|
|
|
20.24 |
|
|
|
21.93 |
|
|
|
19.41 |
|
|
|
9.29 |
|
| Total Crude Oil ($/bbl) |
|
|
|
|
|
|
|
|
|
|
|
|
|
|
|
|
|
|
|
|
|
|
|
|
|
|
|
|
| Sales Price |
|
|
41.38 |
|
|
|
|
|
|
|
31.20 |
|
|
|
39.37 |
|
|
|
34.66 |
|
|
|
33.89 |
|
|
|
15.91 |
|
| Royalties |
|
|
3.66 |
|
|
|
|
|
|
|
1.77 |
|
|
|
2.38 |
|
|
|
1.83 |
|
|
|
1.93 |
|
|
|
0.90 |
|
| Transportation and Blending |
|
|
5.16 |
|
|
|
|
|
|
|
5.84 |
|
|
|
5.25 |
|
|
|
5.74 |
|
|
|
6.56 |
|
|
|
5.89 |
|
| Operating |
|
|
10.32 |
|
|
|
|
|
|
|
10.40 |
|
|
|
10.85 |
|
|
|
9.79 |
|
|
|
9.80 |
|
|
|
11.14 |
|
| Production and Mineral Taxes |
|
|
0.22 |
|
|
|
|
|
|
|
0.16 |
|
|
|
0.17 |
|
|
|
0.18 |
|
|
|
0.16 |
|
|
|
0.11 |
|
| Netback |
|
|
22.02 |
|
|
|
|
|
|
|
13.03 |
|
|
|
20.72 |
|
|
|
17.12 |
|
|
|
15.44 |
|
|
|
(2.13 |
) |
| Natural Gas Liquids ($/bbl) |
|
|
|
|
|
|
|
|
|
|
|
|
|
|
|
|
|
|
|
|
|
|
|
|
|
|
|
|
| Sales Price |
|
|
48.35 |
|
|
|
|
|
|
|
31.16 |
|
|
|
40.79 |
|
|
|
29.71 |
|
|
|
28.11 |
|
|
|
24.99 |
|
| Royalties |
|
|
6.42 |
|
|
|
|
|
|
|
4.21 |
|
|
|
4.97 |
|
|
|
3.58 |
|
|
|
4.20 |
|
|
|
4.03 |
|
| Netback |
|
|
41.93 |
|
|
|
|
|
|
|
26.95 |
|
|
|
35.82 |
|
|
|
26.13 |
|
|
|
23.91 |
|
|
|
20.96 |
|
| Total Liquids ($/bbl) |
|
|
|
|
|
|
|
|
|
|
|
|
|
|
|
|
|
|
|
|
|
|
|
|
|
|
|
|
| Sales Price |
|
|
41.41 |
|
|
|
|
|
|
|
31.20 |
|
|
|
39.38 |
|
|
|
34.64 |
|
|
|
33.87 |
|
|
|
15.97 |
|
| Royalties |
|
|
3.67 |
|
|
|
|
|
|
|
1.79 |
|
|
|
2.39 |
|
|
|
1.84 |
|
|
|
1.94 |
|
|
|
0.92 |
|
| Transportation and Blending |
|
|
5.14 |
|
|
|
|
|
|
|
5.81 |
|
|
|
5.22 |
|
|
|
5.71 |
|
|
|
6.53 |
|
|
|
5.85 |
|
| Operating |
|
|
10.27 |
|
|
|
|
|
|
|
10.35 |
|
|
|
10.80 |
|
|
|
9.74 |
|
|
|
9.76 |
|
|
|
11.08 |
|
| Production and Mineral Taxes |
|
|
0.22 |
|
|
|
|
|
|
|
0.16 |
|
|
|
0.17 |
|
|
|
0.18 |
|
|
|
0.16 |
|
|
|
0.11 |
|
| Netback |
|
|
22.11 |
|
|
|
|
|
|
|
13.09 |
|
|
|
20.80 |
|
|
|
17.17 |
|
|
|
15.48 |
|
|
|
(1.99 |
) |
| Total Natural Gas ($/Mcf) |
|
|
|
|
|
|
|
|
|
|
|
|
|
|
|
|
|
|
|
|
|
|
|
|
|
|
|
|
| Sales Price |
|
|
2.99 |
|
|
|
|
|
|
|
2.32 |
|
|
|
2.99 |
|
|
|
2.49 |
|
|
|
1.53 |
|
|
|
2.31 |
|
| Royalties |
|
|
0.14 |
|
|
|
|
|
|
|
0.10 |
|
|
|
0.15 |
|
|
|
0.10 |
|
|
|
0.04 |
|
|
|
0.09 |
|
| Transportation and Blending |
|
|
0.12 |
|
|
|
|
|
|
|
0.11 |
|
|
|
0.12 |
|
|
|
0.10 |
|
|
|
0.13 |
|
|
|
0.10 |
|
| Operating |
|
|
1.34 |
|
|
|
|
|
|
|
1.15 |
|
|
|
1.25 |
|
|
|
1.05 |
|
|
|
1.06 |
|
|
|
1.23 |
|
| Production and Mineral Taxes |
|
|
0.02 |
|
|
|
|
|
|
|
- |
|
|
|
- |
|
|
|
0.01 |
|
|
|
- |
|
|
|
- |
|
| Netback |
|
|
1.37 |
|
|
|
|
|
|
|
0.96 |
|
|
|
1.47 |
|
|
|
1.23 |
|
|
|
0.30 |
|
|
|
0.89 |
|
| Total (2) ($/BOE)
|
|
|
|
|
|
|
|
|
|
|
|
|
|
|
|
|
|
|
|
|
|
|
|
|
|
|
|
|
| Sales Price |
|
|
36.37 |
|
|
|
|
|
|
|
27.01 |
|
|
|
34.53 |
|
|
|
29.98 |
|
|
|
27.56 |
|
|
|
15.43 |
|
| Royalties |
|
|
3.06 |
|
|
|
|
|
|
|
1.49 |
|
|
|
2.06 |
|
|
|
1.55 |
|
|
|
1.51 |
|
|
|
0.82 |
|
| Transportation and Blending |
|
|
4.20 |
|
|
|
|
|
|
|
4.56 |
|
|
|
4.20 |
|
|
|
4.51 |
|
|
|
5.07 |
|
|
|
4.51 |
|
| Operating |
|
|
9.80 |
|
|
|
|
|
|
|
9.51 |
|
|
|
10.05 |
|
|
|
8.92 |
|
|
|
8.89 |
|
|
|
10.14 |
|
| Production and Mineral Taxes |
|
|
0.20 |
|
|
|
|
|
|
|
0.12 |
|
|
|
0.13 |
|
|
|
0.15 |
|
|
|
0.12 |
|
|
|
0.08 |
|
| Netback |
|
|
19.11 |
|
|
|
|
|
|
|
11.33 |
|
|
|
18.09 |
|
|
|
14.85 |
|
|
|
11.97 |
|
|
|
(0.12 |
) |
| |
|
|
|
|
|
|
|
|
|
|
|
|
|
|
|
|
|
|
|
|
|
|
|
|
|
|
|
|
| Realized Gain (Loss) on Risk Management |
|
|
|
|
|
|
|
|
|
|
|
|
|
|
|
|
|
|
|
|
|
|
|
|
|
|
|
|
| Liquids ($/bbl) |
|
|
(4.53 |
) |
|
|
|
|
|
|
3.23 |
|
|
|
0.91 |
|
|
|
2.14 |
|
|
|
1.97 |
|
|
|
8.16 |
|
| Natural Gas ($/Mcf) |
|
|
- |
|
|
|
|
|
|
|
- |
|
|
|
- |
|
|
|
- |
|
|
|
- |
|
|
|
- |
|
| Total (2)
($/BOE) |
|
|
(3.56 |
) |
|
|
|
|
|
|
2.44 |
|
|
|
0.70 |
|
|
|
1.63 |
|
|
|
1.46 |
|
|
|
6.08 |
|
| (1) |
Netback is a non-GAAP measure commonly used in the oil and gas industry to assist
in measuring operating performance on a per-unit basis. Netbacks reflect our margin on a per-barrel basis of unblended crude oil. Netback is defined as gross sales less
royalties, transportation and blending, operating expenses and production and mineral taxes divided by sales volumes. Netbacks do not reflect the non-cash write-downs of product inventory until the product is
sold. The crude oil sales price, transportation and blending costs, and sales volumes exclude the impact of purchased condensate. Condensate is blended with the heavy oil to reduce its thickness in order to transport it to market. Our Netback
calculation is aligned with the definition found in the Canadian Oil and Gas Evaluation Handbook. The reconciliation of the financial components of each Netback to Operating Margin can be found in our quarterly and annual Management’s
Discussion and Analysis and our Annual Information Form. |
| (2) |
Natural gas volumes have been converted to BOE on the basis of six Mcf to one bbl. BOE may be misleading, particularly if
used in isolation. A conversion ratio of one bbl to six Mcf is based on an energy equivalency conversion method primarily applicable at the burner tip and does not represent value equivalency at the wellhead. Given that the value ratio based on the
current price of crude oil compared to natural gas is significantly different from the energy equivalency conversion ratio of 6:1, utilizing a conversion on a 6:1 basis is not an accurate reflection of value. |
|
|
|
| Cenovus Energy Inc. First Quarter 2017 Report |
|
Page 65 Supplemental
Information |
ADVISORY
FINANCIAL
INFORMATION
Basis of Presentation
Cenovus reports financial results in
Canadian dollars and presents production volumes on a net to Cenovus before royalties basis, unless otherwise stated. Cenovus prepares its financial statements in accordance with International Financial Reporting Standards (IFRS).
OIL AND GAS INFORMATION
Estimates of Reserves
The estimates of reserves were prepared effective December 31, 2016 by independent qualified reserves evaluators, based on the Canadian Oil and Gas Evaluation
Handbook and in compliance with the requirements of National Instrument 51-101 Standards of Disclosure for Oil and Gas Activities. Estimates are presented using McDaniel & Associates Consultants Ltd.
January 1, 2017 price forecast. For additional information about our reserves and other oil and gas information, see “Reserves Data and Other Oil and Gas Information” in our AIF for the year ended December 31, 2016 and our
Statement of Contingent and Prospective Resources.
Barrels of Oil Equivalent
Natural gas volumes have been converted to barrels of oil equivalent (BOE) on the basis of six Mcf to one barrel (bbl). BOE may be misleading,
particularly if used in isolation. A conversion ratio of one bbl to six Mcf is based on an energy equivalency conversion method primarily applicable at the burner tip and does not represent value equivalency at the wellhead. Given that the value
ratio based on the current price of crude oil compared with natural gas is significantly different from the energy equivalency conversion ratio of 6:1, utilizing a conversion on a 6:1 basis is not an accurate reflection of value.
Drilling Locations
This quarterly report discloses potential future
drilling locations in two categories: (a) proved locations and (b) probable locations. This quarterly report also discloses additional un-booked future drilling opportunities. Proved locations and
probable locations are proposed drilling locations identified in reserve reports prepared for assets acquired pursuant to the ConocoPhillips asset acquisition that have proved and/or probable reserves, as applicable, attributed to them in such
reports. Un-booked future drilling opportunities are internal Cenovus estimates based on prospective acreage and an assumption as to the number of wells that can be drilled per section based on industry
practice and internal Cenovus technical analysis and review. Un-booked future drilling opportunities have been identified by Cenovus management based on evaluation of applicable geologic, seismic, engineering,
production and reserves information. Un-booked future drilling opportunities do not have proved or probable reserves attributed to them in the relevant reserves reports. Of the approximately 1,500 identified
drilling opportunities within the Deep Basin assets to be acquired, 212 are proved locations, 221 are probable locations and the remainder are un-booked future drilling opportunities.
Cenovus’s ability to drill and develop these locations and opportunities and the drilling locations on which Cenovus actually drills wells depends
on a number of uncertainties and factors, including, but not limited to, the availability of capital, equipment and personnel, oil and natural gas prices, capital and operating costs, inclement weather, seasonal restrictions, drilling results,
additional geological, geophysical and reservoir information that is obtained, production rate recovery, gathering system and transportation constraints, net price received for commodities produced, regulatory approvals and regulatory changes. As a
result of these uncertainties, there can be no assurance that the potential future drilling locations and opportunities Cenovus has identified will ever be drilled or if Cenovus will be able to produce oil, NGL or natural gas from these or any other
potential drilling locations or opportunities. As such, Cenovus’s actual drilling activities may differ materially from those presently identified,
|
|
|
| Cenovus Energy Inc. First Quarter 2017 Report |
|
Page 66
Advisory |
which could adversely affect Cenovus’s business. While certain of the identified un-booked drilling opportunities have been de-risked by drilling existing wells in relatively close proximity to such un-booked drilling opportunities, some of the other
un-booked drilling opportunities are farther away from existing wells where Cenovus management has less information about the characteristics of the reservoir and therefore there is more uncertainty whether
wells will be drilled and, if drilled, there is further uncertainty that such wells will result in additional proved or probable reserves or production.
NON-GAAP MEASURES AND ADDITIONAL SUBTOTAL
The following measures do not have a standardized meaning as
prescribed by IFRS and therefore are considered non-GAAP measures. You should not consider these measures in isolation or as a substitute for analysis of our results as reported under IFRS. These measures are
defined differently by different companies in our industry. These measures may not be comparable to similar measures presented by other issuers.
Adjusted Funds Flow is used in the oil and gas industry to assist in measuring a company’s ability to finance its capital programs and meet its
financial obligations. Adjusted Funds Flow is defined as Cash From Operating Activities excluding net change in other assets and liabilities and net change in non-cash working capital. Net change in other
assets and liabilities is composed of site restoration costs and pension funding. Non-cash working capital is composed of current assets and current liabilities, excluding cash and cash equivalents and risk
management.
Free Funds Flow is defined as Adjusted Funds Flow less capital investment.
Operating earnings (Loss) is a non-GAAP measure used to provide a consistent measure of the comparability of our
underlying financial performance between periods by removing non-operating items. Operating Earnings (Loss) is defined as Earnings (Loss) Before Income Tax excluding gain (loss) on discontinuance, gain on
bargain purchase, unrealized risk management gains (losses) on derivative instruments, unrealized foreign exchange gains (losses) on translation of U.S. dollar denominated notes issued from Canada, foreign exchange gains (losses) on settlement of
intercompany transactions, gains (losses) on divestiture of assets, less income taxes on Operating Earnings (Loss) before tax, excluding the effect of changes in statutory income tax rates and the recognition of an increase in U.S. tax basis.
Debt to capitalization, net debt to capitalization, debt to adjusted EBITDA and net debt to adjusted EBITDA are ratios that management uses to steward
the company’s overall debt position as measures of the company’s overall financial strength. Debt is defined as short-term borrowings and long-term debt, including the current portion. Net debt is defined as debt net of cash and cash
equivalents. Capitalization is defined as debt plus shareholders’ equity. Net debt to capitalization is defined as net debt divided by net debt plus shareholders’ equity. Adjusted EBITDA is defined as earnings before finance costs,
interest income, income tax expense, depreciation, depletion and amortization, goodwill and asset impairments, unrealized gains or losses on risk management, foreign exchange gains or losses, gains or losses on divestiture of assets and other income
and loss, calculated on a trailing 12-month basis.
Operating margin is an additional subtotal found in Note
1 of the Consolidated Financial Statements and is used to provide a consistent measure of the cash generating performance of our assets for comparability of our underlying financial performance between periods. Operating Margin is defined as
revenues less purchased product, transportation and blending, operating expenses, production and mineral taxes plus realized gains less realized losses on risk management activities. Items within the Corporate and Eliminations segment are excluded
from the calculation of Operating Margin.
|
|
|
| Cenovus Energy Inc. First Quarter 2017 Report |
|
Page 67
Advisory |
FORWARD-LOOKING INFORMATION
This quarterly report contains certain forward-looking statements and forward-looking information (collectively referred to as “forward-looking
information”) within the meaning of applicable securities legislation, including the United States Private Securities Litigation Reform Act of 1995, about our current expectations, estimates and projections about the future, based on certain
assumptions made by us in light of our experience and perception of historical trends. Although we believe that the expectations represented by such forward-looking information are reasonable, there can be no assurance that such expectations will
prove to be correct.
Forward-looking information in this document is identified by words such as “anticipate”, “believe”,
“expect”, “estimate”, “plan”, “forecast”, “future”, “target”, “position”, “project”, “committed”, “can be”, “pursue”, “capacity”,
“could”, “should”, “focus”, “on track”, “outlook”, “potential”, “priority”, “may”, “strategy”, “forward”, “will” or similar expressions and
includes suggestions of future outcomes, including statements about: our strategy, business plans and related milestones and schedules, including expected timing for oil sands expansion phases and associated expected production capacities;
projections for 2017 and future years and our plans and strategies to realize such projections; our future development opportunities; forecast operating and financial results; targets for our Debt to Capitalization and Debt to Adjusted EBITDA
ratios; planned capital expenditures, including the amount, timing and financing thereof; expected future production, including the timing, stability or growth thereof; project capacities; our ability to preserve our financial resilience and various
plans and strategies with respect thereto; forecast cost savings and sustainability thereof; opportunities to improve reservoir performance; potential for development of emerging assets; Cenovus’s positioning for significant value creation at
the close of the acquisition; expected ability for free funds flow generation by conventional oil and natural gas portfolio with moderate spending, and related ability to invest in growth opportunities; potential drilling opportunities; potential
impacts of our hedging program; anticipated use of proceeds of the Bought-Deal Common Share Offering and the Note Offering; completion of the acquisition, including the timing thereof; anticipated impacts to Cenovus of the acquisition upon and after
closing of the acquisition; availability and repayment of the existing credit facility and the Bridge Facility; lender commitments to extend maturities of Cenovus’s existing credit facility; potential asset sales and anticipated use of sales
proceeds; future use and development of technology, including the development of a solvent-aided process at our oil sands operations; development or implementation of technologies and their potential impacts on performance; potential for growth and
value creation; and projected shareholder return. Readers are cautioned not to place undue reliance on forward-looking information as our actual results may differ materially from those expressed or implied.
Developing forward-looking information involves reliance on a number of assumptions and consideration of certain risks and uncertainties, some of which
are specific to Cenovus and others that apply to the industry generally. The factors or assumptions on which the forward-looking information is based include: forecast oil and natural gas prices and other assumptions inherent in Cenovus’s 2017
guidance, available at cenovus.com; our projected capital investment levels, the flexibility of our capital spending plans and the associated source of funding; the achievement of further cost reductions and sustainability thereof; expected
condensate prices; estimates of quantities of oil, bitumen, natural gas and liquids from properties and other sources not currently classified as proved; future use and development of technology; our ability to obtain necessary regulatory and
partner approvals; the successful and timely implementation of capital projects or stages thereof; Cenovus’s ability to generate sufficient cash flow to meet its current and future obligations; estimated abandonment and reclamation costs,
including associated levies and regulations; closing of the acquisition in the second quarter of 2017; successful completion of the acquisition, including timing and availability of all required financing; Cenovus’s ability to successfully
integrate the Deep Basin assets; Cenovus’s ability to obtain and retain qualified staff and equipment in a timely and cost-efficient manner; Cenovus’s ability to access sufficient capital to pursue its development plans; Cenovus’s
ability to complete the potential asset sales, including with desired transaction metrics; anticipated impacts of the acquisition and related financing; forecast crude oil and natural gas prices, forecast inflation and other assumptions inherent in
Cenovus’s current guidance set out below; Cenovus’s projected capital investment levels, the flexibility of capital spending plans and the associated sources of funding; sustainability of achieved cost reductions, achievement of future
cost reductions and sustainability thereof; expected condensate prices; estimates of quantities of oil, bitumen, natural gas and NGLs from properties and other sources not currently classified as proved; future use and development of technology;
Cenovus’s ability to access and implement all
|
|
|
| Cenovus Energy Inc. First Quarter 2017 Report |
|
Page 68
Advisory |
technology necessary to efficiently and effectively operate Cenovus’s assets (including, but not limited to, the acquired assets) and achieve and sustain cost reductions; Cenovus’s
ability to implement capital projects or stages thereof in a successful and timely manner; Cenovus’s ability to generate sufficient cash flow to meet its current and future obligations; and other risks and uncertainties described from time to
time in the filings we make with securities regulatory authorities.
2017 guidance, as updated on December 8, 2016, assumes: Brent prices of
US$48.75/bbl, WTI prices of US$47.25/bbl; WCS of US$31.50/bbl; NYMEX natural gas prices of US$3.00/MMBtu; AECO natural gas prices of $2.60/GJ; Chicago 3-2-1 crack spread
of US$11.25/bbl; and an exchange rate of $0.74 US$/C$.
Unless otherwise specifically stated or the context dictates otherwise, the financial outlook
and forward-looking metrics in this quarterly report, in addition to the generally applicable assumptions described above, do not include or account for the effects or impacts of planned asset sales.
The risk factors and uncertainties that could cause Cenovus’s actual results to differ materially, include: possible failure by us to realize the
anticipated benefits of and synergies from the acquisition; inability to complete the acquisition, including in a timely manner; possible failure to access or implement some or all of the technology necessary to efficiently and effectively operate
our assets (including, but not limited to, the acquired assets) and achieve and sustain future cost reductions; volatility of and other assumptions regarding commodity prices; the effectiveness of Cenovus’s risk management program, including
the impact of derivative financial instruments, the success of its hedging strategies and the sufficiency of its liquidity position; the accuracy of cost estimates; commodity prices, currency and interest rates; possible lack of alignment of
realized WCS prices and WCS prices as calculated under the contingent payment arrangement between Cenovus and a subsidiary of ConocoPhillips following closing of the acquisition; product supply and demand; market competition, including from
alternative energy sources; risks inherent in Cenovus’s marketing operations, including credit risks; exposure to counterparties and partners, including ability and willingness of such parties to satisfy contractual obligations in a timely
manner; risks inherent in the operation of Cenovus’s crude-by-rail terminal, including health, safety and environmental risks; maintaining desirable ratios of Debt
(and Net Debt) to Adjusted EBITDA as well as Debt (and Net Debt) to Capitalization; ability to access various sources of debt and equity capital, generally, and on terms acceptable to Cenovus; ability to finance growth and sustaining capital
expenditures; changes in credit ratings applicable to Cenovus or any of its securities; changes to dividend plans or strategy, including the dividend reinvestment plan; accuracy of reserves, resources, future production and future net revenue
estimates; ability to replace and expand oil and gas reserves; ability to maintain relationships with Cenovus’s partners and to successfully manage and operate its integrated business; reliability of assets including in order to meet production
targets; potential disruption or unexpected technical difficulties in developing new products and manufacturing processes; the occurrence of unexpected events such as fires, severe weather conditions, explosions, blow-outs, equipment failures,
transportation incidents and other accidents or similar events; refining and marketing margins; inflationary pressures on operating costs, including labour, natural gas and other energy sources used in oil sands processes; potential failure of
products to achieve or maintain acceptance in the market; risks associated with fossil fuel industry reputation; unexpected cost increases or technical difficulties in constructing or modifying manufacturing or refining facilities; unexpected
difficulties in producing, transporting or refining of crude oil into petroleum and chemical products; risks associated with technology and its application to Cenovus’s business; risks associated with climate change; the timing and the costs of
well and pipeline construction; ability to secure adequate and cost-effective product transportation including sufficient pipeline, crude-by-rail, marine or alternate
transportation, including to address any gaps caused by constraints in the pipeline system; availability of, and our ability to attract and retain, critical talent; possible failure to obtain and retain qualified staff and equipment in a timely and
cost-efficient manner; changes in labour relationships; changes in the regulatory framework in any of the locations in which Cenovus operates, including changes to the regulatory approval process and land-use
designations, royalty, tax, environmental, greenhouse gas, carbon, climate change and other laws or regulations, or changes to the interpretation of such laws and regulations, as adopted or proposed, the impact thereof and the costs associated with
compliance; the expected impact and timing of various accounting pronouncements, rule changes and standards on Cenovus’s business, its financial results and its consolidated financial statements; changes in general economic, market and business
conditions; the political and economic conditions in the countries in which we operate or supply; occurrence of unexpected events such as war, terrorist threats and the
|
|
|
| Cenovus Energy Inc. First Quarter 2017 Report |
|
Page 69
Advisory |
instability resulting therefrom; and risks associated with existing and potential future lawsuits and regulatory actions against Cenovus.
Statements relating to “reserves” and “resources” are deemed to be forward looking information, as they involve the implied
assessment, based on certain estimates and assumptions, that the reserves and resources described exist in the quantities predicted or estimated, and can be profitably produced in the future.
Readers are cautioned that the foregoing lists are not exhaustive and are made as at the date hereof. Events or circumstances could cause our actual
results to differ materially from those estimated or projected and expressed in, or implied by, the forward-looking information. For a full discussion of Cenovus’s material risk factors, see “Risk Factors” in our Annual Information
Form (AIF) or Form 40-F for the period ended December 31, 2016 and the updates under “Risk Management” in the company’s Management’s Discussion and Analysis (MD&A) for the period
ended March 31, 2017, available on SEDAR at sedar.com, on EDGAR at sec.gov and on Cenovus’s website at cenovus.com.
ABBREVIATIONS
The following is a summary of the abbreviations
that have been used in this document:
|
|
|
|
|
|
|
| Crude Oil |
|
Natural Gas |
|
|
|
|
| bbl |
|
barrel |
|
Mcf |
|
thousand cubic feet |
| bbls/d |
|
barrels per day |
|
MMcf |
|
million cubic feet |
| Mbbls/d |
|
thousand barrels per day |
|
Bcf |
|
billion cubic feet |
| MMbbls |
|
million barrels |
|
MMBtu |
|
million British thermal units |
| BOE |
|
barrel of oil equivalent |
|
GJ |
|
gigajoule |
| BOE/d |
|
Barrel of oil equivalent per day |
|
AECO |
|
Alberta Energy Company |
| MBOE |
|
thousand barrel of oil equivalent |
|
NYMEX |
|
New York Mercantile Exchange |
| MMBOE |
|
million barrel of oil equivalent |
|
|
|
|
| WTI |
|
West Texas Intermediate |
|
|
|
|
| WCS |
|
Western Canadian Select |
|
|
|
|
| CDB |
|
Christina Dilbit Blend |
|
TM |
|
Trademark of Cenovus Energy Inc. |
|
|
|
| Cenovus Energy Inc. First Quarter 2017 Report |
|
Page 70
Advisory |
NETBACK RECONCILIATIONS
The following tables provide a reconcilition of the items comprising Netbacks to Operating Margin found in our Interim Consolidated Financial Statements.
Total Crude Oil, NGLs and Natural Gas
|
|
|
|
|
|
|
|
|
|
|
|
|
|
|
|
|
|
|
|
|
|
|
|
|
|
|
|
|
|
|
|
|
|
|
|
|
|
|
|
|
|
|
|
|
|
|
|
|
|
|
|
|
|
|
|
|
|
|
|
|
| Three Months Ended |
|
Basis of Netback Calculation |
|
|
|
|
|
Adjustments |
|
|
|
|
|
Per Interim Consolidated
Financial Statements (1) |
|
| March 31, 2017
($ millions) |
|
Crude Oil
& NGLs |
|
|
|
|
|
Natural
Gas |
|
|
|
|
|
Total |
|
|
|
|
|
Condensate |
|
|
|
|
|
Inventory |
|
|
|
|
|
Other |
|
|
|
|
|
Other
Products |
|
|
|
|
|
Total
Upstream |
|
|
|
|
|
|
|
|
|
|
|
|
|
|
|
|
|
| Revenues |
|
|
|
|
|
|
|
|
|
|
|
|
|
|
|
|
|
|
|
|
|
|
|
|
|
|
|
|
|
|
|
|
|
|
|
|
|
|
|
|
|
|
|
|
|
|
|
|
|
|
|
|
|
|
|
|
|
|
|
|
| Gross Sales |
|
|
823 |
|
|
|
|
|
|
|
97 |
|
|
|
|
|
|
|
920 |
|
|
|
|
|
|
|
511 |
|
|
|
|
|
|
|
- |
|
|
|
|
|
|
|
1 |
|
|
|
|
|
|
|
4 |
|
|
|
|
|
|
|
1,436 |
|
| Less: Royalties |
|
|
73 |
|
|
|
|
|
|
|
4 |
|
|
|
|
|
|
|
77 |
|
|
|
|
|
|
|
- |
|
|
|
|
|
|
|
- |
|
|
|
|
|
|
|
- |
|
|
|
|
|
|
|
- |
|
|
|
|
|
|
|
77 |
|
|
|
|
750 |
|
|
|
|
|
|
|
93 |
|
|
|
|
|
|
|
843 |
|
|
|
|
|
|
|
511 |
|
|
|
|
|
|
|
- |
|
|
|
|
|
|
|
1 |
|
|
|
|
|
|
|
4 |
|
|
|
|
|
|
|
1,359 |
|
| Expenses |
|
|
|
|
|
|
|
|
|
|
|
|
|
|
|
|
|
|
|
|
|
|
|
|
|
|
|
|
|
|
|
|
|
|
|
|
|
|
|
|
|
|
|
|
|
|
|
|
|
|
|
|
|
|
|
|
|
|
|
|
| Transportation and Blending |
|
|
102 |
|
|
|
|
|
|
|
4 |
|
|
|
|
|
|
|
106 |
|
|
|
|
|
|
|
511 |
|
|
|
|
|
|
|
- |
|
|
|
|
|
|
|
- |
|
|
|
|
|
|
|
- |
|
|
|
|
|
|
|
617 |
|
| Operating |
|
|
205 |
|
|
|
|
|
|
|
44 |
|
|
|
|
|
|
|
249 |
|
|
|
|
|
|
|
- |
|
|
|
|
|
|
|
- |
|
|
|
|
|
|
|
- |
|
|
|
|
|
|
|
1 |
|
|
|
|
|
|
|
250 |
|
| Production and Mineral Taxes |
|
|
4 |
|
|
|
|
|
|
|
1 |
|
|
|
|
|
|
|
5 |
|
|
|
|
|
|
|
- |
|
|
|
|
|
|
|
- |
|
|
|
|
|
|
|
- |
|
|
|
|
|
|
|
- |
|
|
|
|
|
|
|
5 |
|
| Netback |
|
|
439 |
|
|
|
|
|
|
|
44 |
|
|
|
|
|
|
|
483 |
|
|
|
|
|
|
|
- |
|
|
|
|
|
|
|
- |
|
|
|
|
|
|
|
1 |
|
|
|
|
|
|
|
3 |
|
|
|
|
|
|
|
487 |
|
| (Gain) Loss on Risk Management |
|
|
90 |
|
|
|
|
|
|
|
- |
|
|
|
|
|
|
|
90 |
|
|
|
|
|
|
|
- |
|
|
|
|
|
|
|
- |
|
|
|
|
|
|
|
- |
|
|
|
|
|
|
|
- |
|
|
|
|
|
|
|
90 |
|
| Operating Margin |
|
|
349 |
|
|
|
|
|
|
|
44 |
|
|
|
|
|
|
|
393 |
|
|
|
|
|
|
|
- |
|
|
|
|
|
|
|
- |
|
|
|
|
|
|
|
1 |
|
|
|
|
|
|
|
3 |
|
|
|
|
|
|
|
397 |
|
|
|
|
|
|
|
|
|
|
|
|
|
|
|
|
|
|
|
|
|
|
|
|
|
|
|
|
|
|
|
|
|
|
|
|
|
|
|
|
|
|
|
|
|
|
|
|
|
|
|
|
|
|
|
|
|
|
|
|
|
|
| Three Months Ended |
|
Basis of Netback Calculation |
|
|
|
|
|
Adjustments |
|
|
|
|
|
Per Interim Consolidated
Financial Statements (1) |
|
| March 31, 2016
($ millions) |
|
Crude Oil
& NGLs |
|
|
|
|
|
Natural
Gas |
|
|
|
|
|
Total |
|
|
|
|
|
Condensate |
|
|
|
|
|
Inventory |
|
|
|
|
|
Other |
|
|
|
|
|
Other
Products |
|
|
|
|
|
Total
Upstream |
|
|
|
|
|
|
|
|
|
|
|
|
|
|
|
|
|
| Revenues |
|
|
|
|
|
|
|
|
|
|
|
|
|
|
|
|
|
|
|
|
|
|
|
|
|
|
|
|
|
|
|
|
|
|
|
|
|
|
|
|
|
|
|
|
|
|
|
|
|
|
|
|
|
|
|
|
|
|
|
|
| Gross Sales |
|
|
291 |
|
|
|
|
|
|
|
85 |
|
|
|
|
|
|
|
376 |
|
|
|
|
|
|
|
363 |
|
|
|
|
|
|
|
- |
|
|
|
|
|
|
|
1 |
|
|
|
|
|
|
|
4 |
|
|
|
|
|
|
|
744 |
|
| Less: Royalties |
|
|
17 |
|
|
|
|
|
|
|
3 |
|
|
|
|
|
|
|
20 |
|
|
|
|
|
|
|
- |
|
|
|
|
|
|
|
- |
|
|
|
|
|
|
|
- |
|
|
|
|
|
|
|
- |
|
|
|
|
|
|
|
20 |
|
|
|
|
274 |
|
|
|
|
|
|
|
82 |
|
|
|
|
|
|
|
356 |
|
|
|
|
|
|
|
363 |
|
|
|
|
|
|
|
- |
|
|
|
|
|
|
|
1 |
|
|
|
|
|
|
|
4 |
|
|
|
|
|
|
|
724 |
|
| Expenses |
|
|
|
|
|
|
|
|
|
|
|
|
|
|
|
|
|
|
|
|
|
|
|
|
|
|
|
|
|
|
|
|
|
|
|
|
|
|
|
|
|
|
|
|
|
|
|
|
|
|
|
|
|
|
|
|
|
|
|
|
| Transportation and Blending |
|
|
107 |
|
|
|
|
|
|
|
3 |
|
|
|
|
|
|
|
110 |
|
|
|
|
|
|
|
363 |
|
|
|
|
|
|
|
(22 |
) |
|
|
|
|
|
|
- |
|
|
|
|
|
|
|
- |
|
|
|
|
|
|
|
451 |
|
| Operating |
|
|
202 |
|
|
|
|
|
|
|
46 |
|
|
|
|
|
|
|
248 |
|
|
|
|
|
|
|
- |
|
|
|
|
|
|
|
- |
|
|
|
|
|
|
|
(3 |
) |
|
|
|
|
|
|
4 |
|
|
|
|
|
|
|
249 |
|
| Production and Mineral Taxes |
|
|
2 |
|
|
|
|
|
|
|
- |
|
|
|
|
|
|
|
2 |
|
|
|
|
|
|
|
- |
|
|
|
|
|
|
|
- |
|
|
|
|
|
|
|
- |
|
|
|
|
|
|
|
- |
|
|
|
|
|
|
|
2 |
|
| Netback |
|
|
(37 |
) |
|
|
|
|
|
|
33 |
|
|
|
|
|
|
|
(4 |
) |
|
|
|
|
|
|
- |
|
|
|
|
|
|
|
22 |
|
|
|
|
|
|
|
4 |
|
|
|
|
|
|
|
- |
|
|
|
|
|
|
|
22 |
|
| (Gain) Loss on Risk Management |
|
|
(148 |
) |
|
|
|
|
|
|
- |
|
|
|
|
|
|
|
(148 |
) |
|
|
|
|
|
|
- |
|
|
|
|
|
|
|
- |
|
|
|
|
|
|
|
3 |
|
|
|
|
|
|
|
- |
|
|
|
|
|
|
|
(145 |
) |
| Operating Margin |
|
|
111 |
|
|
|
|
|
|
|
33 |
|
|
|
|
|
|
|
144 |
|
|
|
|
|
|
|
- |
|
|
|
|
|
|
|
22 |
|
|
|
|
|
|
|
1 |
|
|
|
|
|
|
|
- |
|
|
|
|
|
|
|
167 |
|
Total Crude Oil and NGLs
|
|
|
|
|
|
|
|
|
|
|
|
|
|
|
|
|
|
|
|
|
|
|
|
|
|
|
|
|
|
|
|
|
|
|
|
|
|
|
|
|
|
|
|
|
|
|
|
|
|
|
|
|
| Three Months Ended |
|
Basis of Netback Calculation |
|
|
|
|
|
Adjustments |
|
|
|
|
|
Per Interim
Consolidated Financial
Statements (1) |
|
| March 31, 2017
($ millions) |
|
Crude Oil |
|
|
|
|
|
NGLs |
|
|
|
|
|
Total |
|
|
|
|
|
Condensate |
|
|
|
|
|
Inventory |
|
|
|
|
|
Other |
|
|
|
|
|
Total Crude
Oil & NGLs |
|
|
|
|
|
|
|
|
|
|
|
|
|
|
|
| Revenues |
|
|
|
|
|
|
|
|
|
|
|
|
|
|
|
|
|
|
|
|
|
|
|
|
|
|
|
|
|
|
|
|
|
|
|
|
|
|
|
|
|
|
|
|
|
|
|
|
|
|
|
|
| Gross Sales |
|
|
818 |
|
|
|
|
|
|
|
5 |
|
|
|
|
|
|
|
823 |
|
|
|
|
|
|
|
511 |
|
|
|
|
|
|
|
- |
|
|
|
|
|
|
|
- |
|
|
|
|
|
|
|
1,334 |
|
| Less: Royalties |
|
|
72 |
|
|
|
|
|
|
|
1 |
|
|
|
|
|
|
|
73 |
|
|
|
|
|
|
|
- |
|
|
|
|
|
|
|
- |
|
|
|
|
|
|
|
- |
|
|
|
|
|
|
|
73 |
|
|
|
|
746 |
|
|
|
|
|
|
|
4 |
|
|
|
|
|
|
|
750 |
|
|
|
|
|
|
|
511 |
|
|
|
|
|
|
|
- |
|
|
|
|
|
|
|
- |
|
|
|
|
|
|
|
1,261 |
|
| Expenses |
|
|
|
|
|
|
|
|
|
|
|
|
|
|
|
|
|
|
|
|
|
|
|
|
|
|
|
|
|
|
|
|
|
|
|
|
|
|
|
|
|
|
|
|
|
|
|
|
|
|
|
|
| Transportation and Blending |
|
|
102 |
|
|
|
|
|
|
|
- |
|
|
|
|
|
|
|
102 |
|
|
|
|
|
|
|
511 |
|
|
|
|
|
|
|
- |
|
|
|
|
|
|
|
- |
|
|
|
|
|
|
|
613 |
|
| Operating |
|
|
205 |
|
|
|
|
|
|
|
- |
|
|
|
|
|
|
|
205 |
|
|
|
|
|
|
|
- |
|
|
|
|
|
|
|
- |
|
|
|
|
|
|
|
- |
|
|
|
|
|
|
|
205 |
|
| Production and Mineral Taxes |
|
|
4 |
|
|
|
|
|
|
|
- |
|
|
|
|
|
|
|
4 |
|
|
|
|
|
|
|
- |
|
|
|
|
|
|
|
- |
|
|
|
|
|
|
|
- |
|
|
|
|
|
|
|
4 |
|
| Netback |
|
|
435 |
|
|
|
|
|
|
|
4 |
|
|
|
|
|
|
|
439 |
|
|
|
|
|
|
|
- |
|
|
|
|
|
|
|
- |
|
|
|
|
|
|
|
- |
|
|
|
|
|
|
|
439 |
|
| (Gain) Loss on Risk Management |
|
|
90 |
|
|
|
|
|
|
|
- |
|
|
|
|
|
|
|
90 |
|
|
|
|
|
|
|
- |
|
|
|
|
|
|
|
- |
|
|
|
|
|
|
|
- |
|
|
|
|
|
|
|
90 |
|
| Operating Margin |
|
|
345 |
|
|
|
|
|
|
|
4 |
|
|
|
|
|
|
|
349 |
|
|
|
|
|
|
|
- |
|
|
|
|
|
|
|
- |
|
|
|
|
|
|
|
- |
|
|
|
|
|
|
|
349 |
|
|
|
|
|
|
|
|
|
|
|
|
|
|
|
|
|
|
|
|
|
|
|
|
|
|
|
|
|
|
|
|
|
|
|
|
|
|
|
|
|
|
|
|
|
|
|
|
|
|
|
|
|
|
| Three Months Ended |
|
Basis of Netback Calculation |
|
|
|
|
|
Adjustments |
|
|
|
|
|
Per Interim
Consolidated Financial Statements
(1) |
|
| March 31, 2016
($ millions) |
|
Crude Oil |
|
|
|
|
|
NGLs |
|
|
|
|
|
Total |
|
|
|
|
|
Condensate |
|
|
|
|
|
Inventory |
|
|
|
|
|
Other |
|
|
|
|
|
Total Crude
Oil & NGLs |
|
|
|
|
|
|
|
|
|
|
|
|
|
|
|
| Revenues |
|
|
|
|
|
|
|
|
|
|
|
|
|
|
|
|
|
|
|
|
|
|
|
|
|
|
|
|
|
|
|
|
|
|
|
|
|
|
|
|
|
|
|
|
|
|
|
|
|
|
|
|
| Gross Sales |
|
|
288 |
|
|
|
|
|
|
|
3 |
|
|
|
|
|
|
|
291 |
|
|
|
|
|
|
|
363 |
|
|
|
|
|
|
|
- |
|
|
|
|
|
|
|
- |
|
|
|
|
|
|
|
654 |
|
| Less: Royalties |
|
|
17 |
|
|
|
|
|
|
|
- |
|
|
|
|
|
|
|
17 |
|
|
|
|
|
|
|
- |
|
|
|
|
|
|
|
- |
|
|
|
|
|
|
|
- |
|
|
|
|
|
|
|
17 |
|
|
|
|
271 |
|
|
|
|
|
|
|
3 |
|
|
|
|
|
|
|
274 |
|
|
|
|
|
|
|
363 |
|
|
|
|
|
|
|
- |
|
|
|
|
|
|
|
- |
|
|
|
|
|
|
|
637 |
|
| Expenses |
|
|
|
|
|
|
|
|
|
|
|
|
|
|
|
|
|
|
|
|
|
|
|
|
|
|
|
|
|
|
|
|
|
|
|
|
|
|
|
|
|
|
|
|
|
|
|
|
|
|
|
|
| Transportation and Blending |
|
|
107 |
|
|
|
|
|
|
|
- |
|
|
|
|
|
|
|
107 |
|
|
|
|
|
|
|
363 |
|
|
|
|
|
|
|
(22 |
) |
|
|
|
|
|
|
- |
|
|
|
|
|
|
|
448 |
|
| Operating |
|
|
202 |
|
|
|
|
|
|
|
- |
|
|
|
|
|
|
|
202 |
|
|
|
|
|
|
|
- |
|
|
|
|
|
|
|
- |
|
|
|
|
|
|
|
(2 |
) |
|
|
|
|
|
|
200 |
|
| Production and Mineral Taxes |
|
|
2 |
|
|
|
|
|
|
|
- |
|
|
|
|
|
|
|
2 |
|
|
|
|
|
|
|
- |
|
|
|
|
|
|
|
- |
|
|
|
|
|
|
|
- |
|
|
|
|
|
|
|
2 |
|
| Netback |
|
|
(40 |
) |
|
|
|
|
|
|
3 |
|
|
|
|
|
|
|
(37 |
) |
|
|
|
|
|
|
- |
|
|
|
|
|
|
|
22 |
|
|
|
|
|
|
|
2 |
|
|
|
|
|
|
|
(13 |
) |
| (Gain) Loss on Risk Management |
|
|
(148 |
) |
|
|
|
|
|
|
- |
|
|
|
|
|
|
|
(148 |
) |
|
|
|
|
|
|
- |
|
|
|
|
|
|
|
- |
|
|
|
|
|
|
|
2 |
|
|
|
|
|
|
|
(146 |
) |
| Operating Margin |
|
|
108 |
|
|
|
|
|
|
|
3 |
|
|
|
|
|
|
|
111 |
|
|
|
|
|
|
|
- |
|
|
|
|
|
|
|
22 |
|
|
|
|
|
|
|
- |
|
|
|
|
|
|
|
133 |
|
| (1) |
Found in Note 1 of the interim Consolidated Financial Statements. |
|
|
|
| Cenovus Energy Inc. First Quarter 2017 Report |
|
Page 71 Netback
Reconciliations |
Oil Sands Crude Oil
|
|
|
|
|
|
|
|
|
|
|
|
|
|
|
|
|
|
|
|
|
|
|
|
|
|
|
|
|
|
|
|
|
|
|
|
|
|
|
|
|
|
|
|
|
| |
|
Basis of Netback Calculation |
|
|
|
|
|
Adjustments |
|
|
|
|
|
Per Interim
Consolidated Financial
Statements (1) |
|
| Three Months Ended March 31, 2017
($ millions) |
|
Foster
Creek |
|
|
|
|
|
Christina
Lake |
|
|
|
|
|
Total
Crude Oil |
|
|
|
|
|
Condensate |
|
|
|
|
|
Inventory |
|
|
|
|
|
Total Oil Sands
Crude Oil |
|
|
|
|
|
|
|
|
|
|
|
|
|
| Revenues |
|
|
|
|
|
|
|
|
|
|
|
|
|
|
|
|
|
|
|
|
|
|
|
|
|
|
|
|
|
|
|
|
|
|
|
|
|
|
|
|
|
|
|
|
| Gross Sales |
|
|
287 |
|
|
|
|
|
|
|
290 |
|
|
|
|
|
|
|
577 |
|
|
|
|
|
|
|
478 |
|
|
|
|
|
|
|
- |
|
|
|
|
|
|
|
1,055 |
|
| Less: Royalties |
|
|
20 |
|
|
|
|
|
|
|
7 |
|
|
|
|
|
|
|
27 |
|
|
|
|
|
|
|
- |
|
|
|
|
|
|
|
- |
|
|
|
|
|
|
|
27 |
|
|
|
|
267 |
|
|
|
|
|
|
|
283 |
|
|
|
|
|
|
|
550 |
|
|
|
|
|
|
|
478 |
|
|
|
|
|
|
|
- |
|
|
|
|
|
|
|
1,028 |
|
| Expenses |
|
|
|
|
|
|
|
|
|
|
|
|
|
|
|
|
|
|
|
|
|
|
|
|
|
|
|
|
|
|
|
|
|
|
|
|
|
|
|
|
|
|
|
|
| Transportation and Blending |
|
|
55 |
|
|
|
|
|
|
|
33 |
|
|
|
|
|
|
|
88 |
|
|
|
|
|
|
|
478 |
|
|
|
|
|
|
|
- |
|
|
|
|
|
|
|
566 |
|
| Operating |
|
|
71 |
|
|
|
|
|
|
|
65 |
|
|
|
|
|
|
|
136 |
|
|
|
|
|
|
|
- |
|
|
|
|
|
|
|
- |
|
|
|
|
|
|
|
136 |
|
| Netback |
|
|
141 |
|
|
|
|
|
|
|
185 |
|
|
|
|
|
|
|
326 |
|
|
|
|
|
|
|
- |
|
|
|
|
|
|
|
- |
|
|
|
|
|
|
|
326 |
|
| (Gain) Loss on Risk Management |
|
|
40 |
|
|
|
|
|
|
|
37 |
|
|
|
|
|
|
|
77 |
|
|
|
|
|
|
|
- |
|
|
|
|
|
|
|
- |
|
|
|
|
|
|
|
77 |
|
| Operating Margin |
|
|
101 |
|
|
|
|
|
|
|
148 |
|
|
|
|
|
|
|
249 |
|
|
|
|
|
|
|
- |
|
|
|
|
|
|
|
- |
|
|
|
|
|
|
|
249 |
|
|
|
|
|
|
|
|
|
|
|
|
|
|
|
|
|
|
|
|
|
|
|
|
|
|
|
|
|
|
|
|
|
|
|
|
|
|
|
|
|
|
|
|
|
|
| |
|
Basis of Netback Calculation |
|
|
|
|
|
Adjustments |
|
|
|
|
|
Per Interim
Consolidated Financial Statements
(1) |
|
| Three Months Ended March 31, 2016
($ millions) |
|
Foster
Creek |
|
|
|
|
|
Christina
Lake |
|
|
|
|
|
Total
Crude Oil |
|
|
|
|
|
Condensate |
|
|
|
|
|
Inventory |
|
|
|
|
|
Total Oil Sands
Crude Oil |
|
|
|
|
|
|
|
|
|
|
|
|
|
| Revenues |
|
|
|
|
|
|
|
|
|
|
|
|
|
|
|
|
|
|
|
|
|
|
|
|
|
|
|
|
|
|
|
|
|
|
|
|
|
|
|
|
|
|
|
|
| Gross Sales |
|
|
65 |
|
|
|
|
|
|
|
65 |
|
|
|
|
|
|
|
130 |
|
|
|
|
|
|
|
335 |
|
|
|
|
|
|
|
- |
|
|
|
|
|
|
|
465 |
|
| Less: Royalties |
|
|
- |
|
|
|
|
|
|
|
- |
|
|
|
|
|
|
|
- |
|
|
|
|
|
|
|
- |
|
|
|
|
|
|
|
- |
|
|
|
|
|
|
|
- |
|
|
|
|
65 |
|
|
|
|
|
|
|
65 |
|
|
|
|
|
|
|
130 |
|
|
|
|
|
|
|
335 |
|
|
|
|
|
|
|
- |
|
|
|
|
|
|
|
465 |
|
| Expenses |
|
|
|
|
|
|
|
|
|
|
|
|
|
|
|
|
|
|
|
|
|
|
|
|
|
|
|
|
|
|
|
|
|
|
|
|
|
|
|
|
|
|
|
|
| Transportation and Blending |
|
|
48 |
|
|
|
|
|
|
|
39 |
|
|
|
|
|
|
|
87 |
|
|
|
|
|
|
|
335 |
|
|
|
|
|
|
|
(18 |
) |
|
|
|
|
|
|
404 |
|
| Operating |
|
|
67 |
|
|
|
|
|
|
|
55 |
|
|
|
|
|
|
|
122 |
|
|
|
|
|
|
|
- |
|
|
|
|
|
|
|
- |
|
|
|
|
|
|
|
122 |
|
| Netback |
|
|
(50 |
) |
|
|
|
|
|
|
(29 |
) |
|
|
|
|
|
|
(79 |
) |
|
|
|
|
|
|
- |
|
|
|
|
|
|
|
18 |
|
|
|
|
|
|
|
(61 |
) |
| (Gain) Loss on Risk Management |
|
|
(52 |
) |
|
|
|
|
|
|
(54 |
) |
|
|
|
|
|
|
(106 |
) |
|
|
|
|
|
|
- |
|
|
|
|
|
|
|
- |
|
|
|
|
|
|
|
(106 |
) |
| Operating Margin |
|
|
2 |
|
|
|
|
|
|
|
25 |
|
|
|
|
|
|
|
27 |
|
|
|
|
|
|
|
- |
|
|
|
|
|
|
|
18 |
|
|
|
|
|
|
|
45 |
|
Conventional Crude Oil and NGLs
|
|
|
|
|
|
|
|
|
|
|
|
|
|
|
|
|
|
|
|
|
|
|
|
|
|
|
|
|
|
|
|
|
|
|
|
|
|
|
|
|
|
|
|
|
|
|
|
|
|
|
|
|
|
|
|
|
|
|
|
|
| |
|
Basis of Netback Calculation |
|
|
|
|
|
Adjustments |
|
|
|
|
|
Per Interim
Consolidated
Financial
Statements(1) |
|
| Three Months Ended
March 31, 2017 ($
millions) |
|
Heavy Oil |
|
|
|
|
|
Light &
Medium |
|
|
|
|
|
NGLs |
|
|
|
|
|
Conventional
Crude Oil & NGLs |
|
|
|
|
|
Condensate |
|
|
|
|
|
Inventory |
|
|
|
|
|
Other |
|
|
|
|
|
Total
Conventional
Crude Oil & NGLs |
|
|
|
|
|
|
|
|
|
|
|
|
|
|
|
|
|
| Revenues |
|
|
|
|
|
|
|
|
|
|
|
|
|
|
|
|
|
|
|
|
|
|
|
|
|
|
|
|
|
|
|
|
|
|
|
|
|
|
|
|
|
|
|
|
|
|
|
|
|
|
|
|
|
|
|
|
|
|
|
|
| Gross Sales |
|
|
113 |
|
|
|
|
|
|
|
128 |
|
|
|
|
|
|
|
5 |
|
|
|
|
|
|
|
246 |
|
|
|
|
|
|
|
33 |
|
|
|
|
|
|
|
- |
|
|
|
|
|
|
|
- |
|
|
|
|
|
|
|
279 |
|
| Less: Royalties |
|
|
16 |
|
|
|
|
|
|
|
29 |
|
|
|
|
|
|
|
1 |
|
|
|
|
|
|
|
46 |
|
|
|
|
|
|
|
- |
|
|
|
|
|
|
|
- |
|
|
|
|
|
|
|
- |
|
|
|
|
|
|
|
46 |
|
|
|
|
97 |
|
|
|
|
|
|
|
99 |
|
|
|
|
|
|
|
4 |
|
|
|
|
|
|
|
200 |
|
|
|
|
|
|
|
33 |
|
|
|
|
|
|
|
- |
|
|
|
|
|
|
|
- |
|
|
|
|
|
|
|
233 |
|
| Expenses |
|
|
|
|
|
|
|
|
|
|
|
|
|
|
|
|
|
|
|
|
|
|
|
|
|
|
|
|
|
|
|
|
|
|
|
|
|
|
|
|
|
|
|
|
|
|
|
|
|
|
|
|
|
|
|
|
|
|
|
|
| Transportation and Blending |
|
|
8 |
|
|
|
|
|
|
|
6 |
|
|
|
|
|
|
|
- |
|
|
|
|
|
|
|
14 |
|
|
|
|
|
|
|
33 |
|
|
|
|
|
|
|
- |
|
|
|
|
|
|
|
- |
|
|
|
|
|
|
|
47 |
|
| Operating |
|
|
31 |
|
|
|
|
|
|
|
38 |
|
|
|
|
|
|
|
- |
|
|
|
|
|
|
|
69 |
|
|
|
|
|
|
|
- |
|
|
|
|
|
|
|
- |
|
|
|
|
|
|
|
- |
|
|
|
|
|
|
|
69 |
|
| Production and Mineral Taxes |
|
|
- |
|
|
|
|
|
|
|
4 |
|
|
|
|
|
|
|
- |
|
|
|
|
|
|
|
4 |
|
|
|
|
|
|
|
- |
|
|
|
|
|
|
|
- |
|
|
|
|
|
|
|
- |
|
|
|
|
|
|
|
4 |
|
| Netback |
|
|
58 |
|
|
|
|
|
|
|
51 |
|
|
|
|
|
|
|
4 |
|
|
|
|
|
|
|
113 |
|
|
|
|
|
|
|
- |
|
|
|
|
|
|
|
- |
|
|
|
|
|
|
|
- |
|
|
|
|
|
|
|
113 |
|
| (Gain) Loss on Risk Management |
|
|
7 |
|
|
|
|
|
|
|
6 |
|
|
|
|
|
|
|
- |
|
|
|
|
|
|
|
13 |
|
|
|
|
|
|
|
- |
|
|
|
|
|
|
|
- |
|
|
|
|
|
|
|
- |
|
|
|
|
|
|
|
13 |
|
| Operating Margin |
|
|
51 |
|
|
|
|
|
|
|
45 |
|
|
|
|
|
|
|
4 |
|
|
|
|
|
|
|
100 |
|
|
|
|
|
|
|
- |
|
|
|
|
|
|
|
- |
|
|
|
|
|
|
|
- |
|
|
|
|
|
|
|
100 |
|
|
|
|
|
|
|
|
|
|
|
|
|
|
|
|
|
|
|
|
|
|
|
|
|
|
|
|
|
|
|
|
|
|
|
|
|
|
|
|
|
|
|
|
|
|
|
|
|
|
|
|
|
|
|
|
|
|
|
|
|
|
| |
|
Basis of Netback Calculation |
|
|
|
|
|
Adjustments |
|
|
|
|
|
Per Interim
Consolidated
Financial
Statements (1) |
|
| Three Months Ended
March 31, 2016 ($
millions) |
|
Heavy Oil |
|
|
|
|
|
Light &
Medium |
|
|
|
|
|
NGLs |
|
|
|
|
|
Conventional
Crude Oil & NGLs |
|
|
|
|
|
Condensate |
|
|
|
|
|
Inventory |
|
|
|
|
|
Other |
|
|
|
|
|
Total
Conventional
Crude Oil & NGLs |
|
|
|
|
|
|
|
|
|
|
|
|
|
|
|
|
|
| Revenues |
|
|
|
|
|
|
|
|
|
|
|
|
|
|
|
|
|
|
|
|
|
|
|
|
|
|
|
|
|
|
|
|
|
|
|
|
|
|
|
|
|
|
|
|
|
|
|
|
|
|
|
|
|
|
|
|
|
|
|
|
| Gross Sales |
|
|
73 |
|
|
|
|
|
|
|
85 |
|
|
|
|
|
|
|
3 |
|
|
|
|
|
|
|
161 |
|
|
|
|
|
|
|
28 |
|
|
|
|
|
|
|
- |
|
|
|
|
|
|
|
- |
|
|
|
|
|
|
|
189 |
|
| Less: Royalties |
|
|
4 |
|
|
|
|
|
|
|
13 |
|
|
|
|
|
|
|
- |
|
|
|
|
|
|
|
17 |
|
|
|
|
|
|
|
- |
|
|
|
|
|
|
|
- |
|
|
|
|
|
|
|
- |
|
|
|
|
|
|
|
17 |
|
|
|
|
69 |
|
|
|
|
|
|
|
72 |
|
|
|
|
|
|
|
3 |
|
|
|
|
|
|
|
144 |
|
|
|
|
|
|
|
28 |
|
|
|
|
|
|
|
- |
|
|
|
|
|
|
|
- |
|
|
|
|
|
|
|
172 |
|
| Expenses |
|
|
|
|
|
|
|
|
|
|
|
|
|
|
|
|
|
|
|
|
|
|
|
|
|
|
|
|
|
|
|
|
|
|
|
|
|
|
|
|
|
|
|
|
|
|
|
|
|
|
|
|
|
|
|
|
|
|
|
|
| Transportation and Blending |
|
|
13 |
|
|
|
|
|
|
|
7 |
|
|
|
|
|
|
|
- |
|
|
|
|
|
|
|
20 |
|
|
|
|
|
|
|
28 |
|
|
|
|
|
|
|
(4 |
) |
|
|
|
|
|
|
- |
|
|
|
|
|
|
|
44 |
|
| Operating |
|
|
40 |
|
|
|
|
|
|
|
40 |
|
|
|
|
|
|
|
- |
|
|
|
|
|
|
|
80 |
|
|
|
|
|
|
|
- |
|
|
|
|
|
|
|
- |
|
|
|
|
|
|
|
(2 |
) |
|
|
|
|
|
|
78 |
|
| Production and Mineral Taxes |
|
|
- |
|
|
|
|
|
|
|
2 |
|
|
|
|
|
|
|
- |
|
|
|
|
|
|
|
2 |
|
|
|
|
|
|
|
- |
|
|
|
|
|
|
|
- |
|
|
|
|
|
|
|
- |
|
|
|
|
|
|
|
2 |
|
| Netback |
|
|
16 |
|
|
|
|
|
|
|
23 |
|
|
|
|
|
|
|
3 |
|
|
|
|
|
|
|
42 |
|
|
|
|
|
|
|
- |
|
|
|
|
|
|
|
4 |
|
|
|
|
|
|
|
2 |
|
|
|
|
|
|
|
48 |
|
| (Gain) Loss on Risk Management |
|
|
(22 |
) |
|
|
|
|
|
|
(20 |
) |
|
|
|
|
|
|
- |
|
|
|
|
|
|
|
(42 |
) |
|
|
|
|
|
|
- |
|
|
|
|
|
|
|
- |
|
|
|
|
|
|
|
2 |
|
|
|
|
|
|
|
(40 |
) |
| Operating Margin |
|
|
38 |
|
|
|
|
|
|
|
43 |
|
|
|
|
|
|
|
3 |
|
|
|
|
|
|
|
84 |
|
|
|
|
|
|
|
- |
|
|
|
|
|
|
|
4 |
|
|
|
|
|
|
|
- |
|
|
|
|
|
|
|
88 |
|
| (1) |
Found in Note 1 of the interim Consolidated Financial Statements. |
|
|
|
| Cenovus Energy Inc. First Quarter 2017 Report |
|
Page 72 Netback
Reconciliations |
The following table provides the sales volumes used to calculate Netback.
Sales Volumes
|
|
|
|
|
|
|
|
|
|
|
|
|
| |
|
Three Months Ended March 31, |
|
| (barrels per day, unless otherwise stated) |
|
2017 |
|
|
|
|
|
2016 |
|
|
|
|
|
| Oil Sands |
|
|
|
|
|
|
|
|
|
|
|
|
| Foster Creek |
|
|
78,562 |
|
|
|
|
|
|
|
60,169 |
|
| Christina Lake |
|
|
89,919 |
|
|
|
|
|
|
|
80,118 |
|
|
|
|
168,481 |
|
|
|
|
|
|
|
140,287 |
|
| Conventional |
|
|
|
|
|
|
|
|
|
|
|
|
| Heavy Oil |
|
|
26,222 |
|
|
|
|
|
|
|
30,764 |
|
| Light and Medium Oil |
|
|
25,074 |
|
|
|
|
|
|
|
27,210 |
|
| Natural Gas Liquids (“NGLs”) |
|
|
1,047 |
|
|
|
|
|
|
|
1,208 |
|
|
|
|
52,343 |
|
|
|
|
|
|
|
59,182 |
|
| Crude Oil and NGLs Sales |
|
|
220,824 |
|
|
|
|
|
|
|
199,469 |
|
|
|
|
|
| Natural Gas Sales (MMcf per day) |
|
|
363 |
|
|
|
|
|
|
|
408 |
|
|
|
|
|
| Total Sales (BOE per day) |
|
|
281,324 |
|
|
|
|
|
|
|
267,469 |
|
|
|
|
| Cenovus Energy Inc. First Quarter 2017 Report |
|
Page 73 Netback
Reconciliations |

|
|
|
| Cenovus Energy Inc.
500 Centre Street SE
PO Box 766
Calgary, AB T2P 0M5
Phone: 403-766-2000
Fax: 403-766-7600 |
|
|
|
| CENOVUS CONTACTS |
|
|
| Investor Relations: |
|
Media: |
|
|
| Kam Sandhar |
|
General media line |
| Vice-President, Investor Relations &
Corporate Development |
|
403-766-7751 |
| 403-766-5883 |
|
media.relations@cenovus.com |
| kam.sandhar@cenovus.com |
|
|
|
|
| Graham Ingram |
|
|
| Manager, Investor Relations |
|
|
| 403-766-2849 |
|
|
| graham.ingram@cenovus.com |
|
|
|
|
| Steven Murray |
|
|
| Senior Analyst, Investor Relations |
|
|
| 403-766-3382 |
|
|
| steven.murray@cenovus.com |
|
|
|
|
| Michelle Cheyne
Analyst, Investor Relations 403-766-2584 michelle.cheyne@cenovus.com |
|
|
cenovus.com
This regulatory filing also includes additional resources:
d379222dex9911.pdf
Cenovus Energy (NYSE:CVE)
Historical Stock Chart
From Mar 2024 to Apr 2024

Cenovus Energy (NYSE:CVE)
Historical Stock Chart
From Apr 2023 to Apr 2024
