JetBlue Airways Reports January Traffic
February 10 2017 - 8:00AM
Business Wire
JetBlue Airways Corporation (NASDAQ:JBLU) reported its
preliminary traffic results for January 2017. Traffic in January
increased 8.6 percent from January 2016, on a capacity increase of
7.7 percent.
Load factor for January 2017 was 83.3 percent, an increase of
0.7 points from January 2016. JetBlue’s preliminary completion
factor was 97.9 percent and its on-time (1) performance was 72.8
percent. JetBlue’s preliminary revenue per available seat mile for
the month of January decreased approximately 8.5 percent year over
year. January revenue per available seat mile was negatively
impacted by approximately 5 points due to holiday placement and the
impact of winter weather last year.
JETBLUE AIRWAYS TRAFFIC RESULTS
January
2017 January 2016 % Change Revenue passenger
miles (000) 3,863,193 3,555,862 8.6% Available seat miles (000)
4,636,641 4,306,365 7.7% Load factor 83.3% 82.6% 0.7 pts. Revenue
passengers 3,290,528 2,947,210 11.6% Departures 29,329 27,032 8.5%
Average stage length (miles) 1,078 1,103 -2.3% (1) The U.S.
Department of Transportation considers on-time arrivals to be those
domestic flights arriving within 14 minutes of schedule.
JetBlue is New York's Hometown Airline®, and a leading carrier
in Boston, Fort Lauderdale-Hollywood, Los Angeles (Long Beach),
Orlando, and San Juan. JetBlue carries more than 38 million
customers a year to 100 cities in the U.S., Caribbean, and Latin
America with an average of 925 daily flights. For more information
please visit jetblue.com.
View source
version on businesswire.com: http://www.businesswire.com/news/home/20170210005110/en/
JetBlue Investor RelationsTel: +1
718-709-2202ir@jetblue.comorJetBlue Corporate
CommunicationsTel: +1 718-709-3089corpcomm@jetblue.com
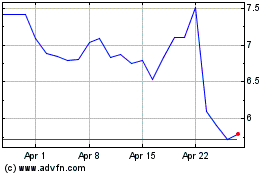
JetBlue Airways (NASDAQ:JBLU)
Historical Stock Chart
From Mar 2024 to Apr 2024

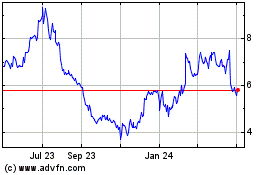
JetBlue Airways (NASDAQ:JBLU)
Historical Stock Chart
From Apr 2023 to Apr 2024
