American Airlines' Profit Falls
October 20 2016 - 8:50AM
Dow Jones News
American Airlines Group Inc.'s profit and revenue fell amid
continued overcapacity, which has plagued other U.S. airlines, as
it continued to spend to integrate US Airways Group into the
company.
American has been busy integrating its operations since the late
2013 merger of American Airlines and US Airways. Earlier in
October, the airline brought US Airways pilots onto the American IT
platform.
American said it booked $294 million in net special charges
during the third quarter, mostly on merger integration expenses
relating to rebranding of aircraft, airport facilities and
uniforms, information technology, alignment of labor-union
contracts and fleet restructuring.
Excluding those efforts and other special items, profit beat
Wall Street's views. American Airlines shares rose 1.2% to $41.10,
and several other airline stocks rose premarket as well.
American's unit revenue—the amount the company takes in for each
passenger flown a mile—fell 3.3% in the quarter that ended in
September. The company predicted a 2% to 3% year-over-year
drop.
American, the top U.S. airline by traffic, and other carriers
are struggling with weak unit revenues, caused by too many flights
and seats being offered than demand warrants. Still, their bottom
lines have been cushioned by lower fuel prices.
Delta Air Lines Inc., the nation's No. 2 carrier, reported last
week that revenue fell but said that it expects passenger revenue
per available seat mile to turn positive early next year. United
Continental Holdings Inc., the No. 3 carrier, also reporting
revenue declines.
American in the latest period posted a profit of $737 million,
or $1.40 a share, compared with $1.69 billion, or $2.49 a share, in
the year-ago period. Excluding special items, such as the
merger-related expenses, the company said it earned $1.76 a share,
topping estimates from analysts polled by Thomson Reuters, who
expected $1.69. Excluding items as well as a noncash income tax
provision, the company said it earned $2.80 a share.
Revenue slipped 1% to $10.59 billion. Analysts anticipated
$10.54 billion.
Capacity rose 1.2% during the quarter.
Write to Joshua Jamerson at joshua.jamerson@wsj.com
(END) Dow Jones Newswires
October 20, 2016 08:35 ET (12:35 GMT)
Copyright (c) 2016 Dow Jones & Company, Inc.
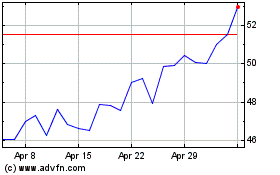
Delta Air Lines (NYSE:DAL)
Historical Stock Chart
From Mar 2024 to Apr 2024

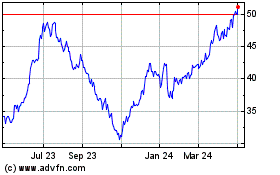
Delta Air Lines (NYSE:DAL)
Historical Stock Chart
From Apr 2023 to Apr 2024
