Big Lots Posts Revenue Decline But Raises Forecast
August 26 2016 - 7:50AM
Dow Jones News
Big Lots Inc. on Friday reported soft comparable-store sales and
a revenue decline but raised its profit forecast for the year.
The Ohio-based company buys a range of merchandise discounted as
a result of liquidations, production overruns and packaging changes
and sells it at significantly lower prices than traditional
discount retailers.
Sales at stores open at least 15 months increased 0.3%, on the
low end of the company's projected range of between flat and 2%.
Revenue fell as the comparable store increase was offset by a
smaller number of stores.
The underwhelming results followed fellow discounters Dollar
General Corp. and Dollar Tree Inc. which also reported lower
comparable results than the prior period.
For the current year, Big Lots now expects adjusted per-share
earnings of $3.45 to $3.55, up from its previous forecast of
between $3.35 and $3.50 a share. Analysts polled by Thomson Reuters
had expected earnings of $3.47. The company said it expects
comparable-store sales to increase in the low-single-digits,
reaffirming its previous quarter.
For the third quarter, the company estimates adjusted earnings
per share in the range of a 4 cent loss to a 1 cent gain. Analysts
are expecting a 1 cent loss.
In all for the quarter ended July 30, Big Lots reported a profit
of $45 million, or 50 cents a share, up from $17.6 million, or 34
cents a share, a year prior. The number of shares outstanding fell
12%.
Excluding legacy pension costs and other charges, Big Lots
posted an adjusted profit of 52 cents a share.
Revenue fell 0.5% to $1.2 billion. Analysts had expected revenue
of $1.22 billion and profit of 46 cents.
Gross margin increased to 40.4% from 39.3%.
Shares in the company, up 18% over the past three months, were
inactive premarket.
Write to Austen Hufford at austen.hufford@wsj.com
(END) Dow Jones Newswires
August 26, 2016 07:35 ET (11:35 GMT)
Copyright (c) 2016 Dow Jones & Company, Inc.
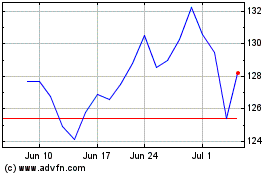
Dollar General (NYSE:DG)
Historical Stock Chart
From Mar 2024 to Apr 2024

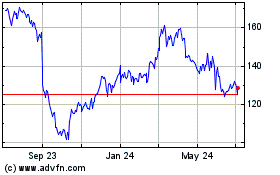
Dollar General (NYSE:DG)
Historical Stock Chart
From Apr 2023 to Apr 2024
