Pacific Biosciences of California, Inc. Announces Second Quarter 2016 Financial Results
August 04 2016 - 4:00PM

Pacific Biosciences of California, Inc. (NASDAQ:PACB) today
announced financial results for its second quarter ended June 30,
2016.
Revenue for the second quarter of 2016 totaled $20.7 million,
compared to $24.9 million for the second quarter of 2015. Product
and service revenue for the second quarter of 2016 increased by 51%
to $17.1 million, compared to $11.3 million for the second quarter
of 2015. Contractual revenue for the second quarter of 2016
was $3.6 million, compared to $13.6 million for the second quarter
of 2015. Both quarters reflected $3.6 million of
amortization of the upfront payment pursuant to the Company’s
development, commercialization and license agreement with F.
Hoffman-La Roche Ltd (the “Roche Agreement”). Second quarter 2015
contractual revenue also included $10.0 million of milestone
revenue from the Roche Agreement.
Gross profit for the second quarter of 2016 was $10.6 million,
resulting in a gross margin of 51.3%, compared to gross profit of
$14.5 million and a gross margin of 58.2% for the second quarter of
2015. The gross profit and margin for the second quarter of 2015
included $10.0 million of milestone revenue from the Roche
Agreement at a 100% margin. Excluding this milestone revenue, gross
profit and gross margin for the second quarter of 2016 increased
significantly over the same period in 2015 primarily as a result of
the higher margin sales of the Company’s SequelTM System which was
launched in the fourth quarter of 2015.
Operating expenses for the second quarter of 2016 totaled $28.7
million, compared to $25.9 million for the second quarter of 2015.
Operating expenses for the second quarter of 2016 and 2015 included
non-cash stock-based compensation of $4.4 million and $3.0 million,
respectively.
Net loss for the second quarter of 2016 was $18.5 million,
compared to $11.9 million for the second quarter of 2015.
Cash and investments at June 30, 2016 totaled $102.5 million,
compared to $82.3 million at December 31, 2015.
Quarterly Conference Call Information
Management will host a quarterly conference call to discuss its
second quarter 2016 results today at 4:30 p.m. Eastern Time.
Investors may listen to the call by dialing 1.888.366.7247, or if
outside the U.S., by dialing +1.707.287.9330. The call will be
webcast live and will be available for replay at Pacific
Biosciences’ website at http://investor.pacificbiosciences.com/
.
About Pacific Biosciences
Pacific Biosciences of California, Inc. (NASDAQ:PACB) offers
sequencing systems to help scientists resolve genetically complex
problems. Based on its novel Single Molecule, Real-Time (SMRT®)
Technology, Pacific Biosciences’ products enable: de novo genome
assembly to finish genomes in order to more fully identify,
annotate and decipher genomic structures; full-length transcript
analysis to improve annotations in reference genomes, characterize
alternatively spliced isoforms in important gene families, and find
novel genes; targeted sequencing to more comprehensively
characterize genetic variations; and real-time kinetic information
for epigenome characterization. Pacific Biosciences’ technology
provides high accuracy, ultra-long reads, uniform coverage, and is
the only DNA sequencing technology that provides the ability to
simultaneously detect epigenetic changes. PacBio® sequencing
systems, including consumables and software, provide a simple,
fast, end-to-end workflow for SMRT Sequencing. More
information is available at www.pacb.com
Forward-Looking StatementsAll statements in
this press release that are not historical are forward-looking
statements, including, among other things, statements relating to
the timeline for Pacific Biosciences’ potential development of
products, including for Roche, future uses, quality or performance
of, or benefits of using, products or technologies and other future
events. You should not place undue reliance on forward-looking
statements because they involve known and unknown risks,
uncertainties, changes in circumstances and other factors that are,
in some cases, beyond Pacific Biosciences’ control and could cause
actual results to differ materially from the information expressed
or implied by forward-looking statements made in this press
release. Factors that could materially affect actual results can be
found in Pacific Biosciences’ most recent filings with the
Securities and Exchange Commission, including Pacific Biosciences’
most recent reports on Forms 8-K, 10-K and 10-Q, and include those
listed under the caption “Risk Factors.” Pacific Biosciences
undertakes no obligation to revise or update information in this
press release to reflect events or circumstances in the future,
even if new information becomes available.
| Pacific
Biosciences of California, Inc. |
| Unaudited
Condensed Consolidated Statement of Operations |
| (amounts in thousands,
except per share amounts) |
|
|
|
|
|
|
|
|
|
|
|
|
|
|
| |
|
Three-month Periods Ended June
30, |
|
Six-month Periods Ended June 30, |
| |
|
2016 |
|
2015 |
|
2016 |
|
2015 |
| Revenue: |
|
|
|
|
|
|
|
|
|
|
|
|
| Product revenue |
|
$ |
|
13,587 |
|
|
$ |
|
8,825 |
|
|
$ |
|
25,966 |
|
|
$ |
|
20,133 |
|
| Service and other revenue |
|
|
|
3,564 |
|
|
|
|
2,518 |
|
|
|
|
6,716 |
|
|
|
|
5,259 |
|
| Contractual revenue |
|
|
|
3,596 |
|
|
|
|
13,596 |
|
|
|
|
7,192 |
|
|
|
|
17,192 |
|
| Total revenue |
|
|
|
20,747 |
|
|
|
|
24,939 |
|
|
|
|
39,874 |
|
|
|
|
42,584 |
|
| Cost of Revenue: |
|
|
|
|
|
|
|
|
|
|
|
|
| Cost of product revenue |
|
|
|
7,115 |
|
|
|
|
8,438 |
|
|
|
|
13,995 |
|
|
|
|
18,170 |
|
| Cost of service and other
revenue |
|
|
|
2,988 |
|
|
|
|
1,995 |
|
|
|
|
5,731 |
|
|
|
|
3,981 |
|
| Total cost of revenue |
|
|
|
10,103 |
|
|
|
|
10,433 |
|
|
|
|
19,726 |
|
|
|
|
22,151 |
|
| Gross profit |
|
|
|
10,644 |
|
|
|
|
14,506 |
|
|
|
|
20,148 |
|
|
|
|
20,433 |
|
| Operating Expense: |
|
|
|
|
|
|
|
|
|
|
|
|
| Research and development |
|
|
|
17,522 |
|
|
|
|
15,043 |
|
|
|
|
33,883 |
|
|
|
|
29,526 |
|
| Sales, general and
administrative |
|
|
|
11,192 |
|
|
|
|
10,821 |
|
|
|
|
22,900 |
|
|
|
|
21,593 |
|
| Total operating expense |
|
|
|
28,714 |
|
|
|
|
25,864 |
|
|
|
|
56,783 |
|
|
|
|
51,119 |
|
| Operating loss |
|
|
|
(18,070 |
) |
|
|
|
(11,358 |
) |
|
|
|
(36,635 |
) |
|
|
|
(30,686 |
) |
| Interest income (expense) |
|
|
|
(795 |
) |
|
|
|
(715 |
) |
|
|
|
(1,574 |
) |
|
|
|
(1,412 |
) |
| Other income (expense), net |
|
|
|
366 |
|
|
|
|
138 |
|
|
|
|
358 |
|
|
|
|
(10 |
) |
| Net loss |
|
$ |
|
(18,499 |
) |
|
$ |
|
(11,935 |
) |
|
$ |
|
(37,851 |
) |
|
$ |
|
(32,108 |
) |
| Basic and diluted net loss per share |
|
$ |
|
(0.21 |
) |
|
$ |
|
(0.16 |
) |
|
$ |
|
(0.44 |
) |
|
$ |
|
(0.43 |
) |
| Shares used in computing basic and diluted net
loss per share |
|
|
|
88,148 |
|
|
|
|
74,733 |
|
|
|
|
85,876 |
|
|
|
|
74,442 |
|
| |
|
|
|
|
|
|
|
|
|
|
|
|
|
|
|
|
|
|
|
|
| Pacific
Biosciences of California, Inc. |
| Unaudited
Condensed Consolidated Balance Sheets |
| (amounts in
thousands) |
| |
|
|
|
|
|
|
| |
|
June
30, |
|
December 31, |
| |
|
2016 |
|
2015 |
| Assets |
|
|
|
|
| Cash and investments |
|
$ |
102,470 |
|
$ |
82,270 |
| Accounts receivable |
|
|
10,427 |
|
|
5,245 |
| Inventory |
|
|
14,201 |
|
|
10,955 |
| Prepaid and other current
assets |
|
|
10,957 |
|
|
12,071 |
| Property and equipment |
|
|
11,188 |
|
|
8,548 |
| Long-term restricted cash |
|
|
4,500 |
|
|
4,500 |
| Other long-term Assets |
|
|
7,628 |
|
|
7,518 |
| Total
Assets |
|
$ |
161,371 |
|
$ |
131,107 |
| |
|
|
|
|
|
|
| Liabilities and
Stockholders' Equity |
|
|
|
|
|
|
| Accounts payable |
|
$ |
5,395 |
|
$ |
4,749 |
| Accrued expenses |
|
|
16,329 |
|
|
15,551 |
| Deferred service revenue |
|
|
7,922 |
|
|
7,958 |
| Deferred contractual revenue |
|
|
4,942 |
|
|
12,134 |
| Other liabilities |
|
|
2,954 |
|
|
1,627 |
| Financing derivative |
|
|
264 |
|
|
600 |
| Notes payable |
|
|
15,496 |
|
|
14,948 |
| Stockholders' equity |
|
|
108,069 |
|
|
73,540 |
| Total
Liabilities and Stockholders' Equity |
|
$ |
161,371 |
|
$ |
131,107 |
|
|
|
|
|
|
|
|
Contact:
Trevin Rard
650.521.8450
ir@pacificbiosciences.com
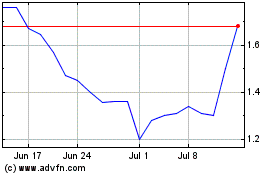
Pacific Biosciences of C... (NASDAQ:PACB)
Historical Stock Chart
From Mar 2024 to Apr 2024

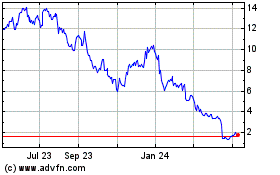
Pacific Biosciences of C... (NASDAQ:PACB)
Historical Stock Chart
From Apr 2023 to Apr 2024
