Fidelity Just Made Buying an Index Fund as Cheap as Vanguard
June 28 2016 - 2:40PM
Dow Jones News
Money manager Fidelity Investments plans to slash prices on more
than two dozen funds, a concession to an industry movement toward
cheap products that track the market.
The changes will lower Fidelity's fees below or on par with
those at low-cost pioneer Vanguard Group and Charles Schwab,
another firm that offers ultralow customer expenses. Fidelity
oversees retirements for millions of Americans.
Fidelity's fee cuts mark a more aggressive approach by the
privately held company long known for pricier investment products
run by star stock pickers. In recent years, the Boston money
management giant has lost some cash to rivals emphasizing so-called
passive investments that mimic indexes for a fraction of the cost
of a typical mutual fund.
Fidelity's discounts will reduce the net fees on the investor
share class of the Fidelity 500 Index Fund, which mirrors the
S&P 500, to 0.09% from 0.095%. That is the same as a comparable
product at Charles Schwab Corp. and lower than the Vanguard 500
Index Fund Investor Shares fund, which costs 0.16%. Fidelity's
price reductions are effective this Friday.
Fees across the money management industry are falling as firms
duel for increasingly cost-obsessed investors and undercut each
other on price to gain scale. The race to the bottom has forced
some money managers to sell nearly free funds that are lower than
their operating costs.
The result has been a boon for individual investors. In 2015,
they paid lower fund fees than any previous year tracked by
fund-research firm Morningstar Inc. The asset-weighted expense
ratio for passive funds in the U.S. dropped to 0.19% at the end of
May, compared to 0.26% in 2010. For actively-managed funds the
asset-weighted fee is 0.78% down from 0.84% in 2010.
Investors pulled more than $300 billion from U.S. actively
managed funds in the 12 months through the end of May, according to
Morningstar, while investing upward of $375 billion in passive
funds.
A main beneficiary of this shift to passive funds has been
Vanguard. The Malvern, Pa.-based firm launched the first index fund
for individual investors nearly 40 years ago and last year pulled
in $236 billion from clients, an industry record. It has the lowest
asset-weighted average expense ratio of any mutual-fund firm,
according to Morningstar. The firm is owned by its funds'
shareholders and automatically lowers fees as its funds grow.
Fidelity, on the other hand, has long touted its emphasis on
actively managed investments. It remains one of the largest
operators of funds that attempt to beat the market by handpicking
winning stocks and bonds, according to Morningstar.
A more aggressive strategy for Fidelity's passively managed
funds began under current Chief Executive Abigail Johnson, who
succeeded her father, Edward "Ned" Johnson III. In recent months,
the firm has moved to broaden its distribution of those products
and boost their assets under management. Fidelity has offered index
funds for 25 years.
"We are strong believers in the powers of active management and
the value it can provide our customers. That view has not changed,"
said Colby Penzone, senior vice president for Fidelity's investment
product group. "Active and passive can play a role in client
portfolio," he said.
Fidelity's fee alterations will reduce prices on 27 of its index
mutual funds and exchange-traded funds. The cuts at Fidelity affect
funds that offer broad exposure to large-, mid- and small-cap
indexes as well as a number of bond funds and ETFs that offer
exposure to specific sectors.
Fidelity managed $2.1 trillion in assets at the end of May. In
the firm's most recent annual report published earlier this year,
Fidelity said investors withdrew a net $18.8 billion from its
actively managed stock funds in 2015, "driven by investors' ongoing
preference for passive equity products," but didn't disclose
similar flow information for its passively managed funds.
Write to Sarah Krouse at sarah.krouse@wsj.com
(END) Dow Jones Newswires
June 28, 2016 14:25 ET (18:25 GMT)
Copyright (c) 2016 Dow Jones & Company, Inc.
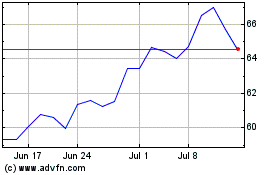
Citigroup (NYSE:C)
Historical Stock Chart
From Mar 2024 to Apr 2024

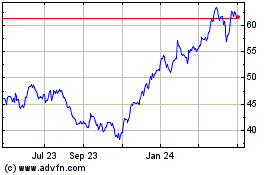
Citigroup (NYSE:C)
Historical Stock Chart
From Apr 2023 to Apr 2024
