Finding Cheap Oil in the 21st Century: Some Go Back to Basics
It was less than three years ago when the IEA predicted that by
2020, the US would pump past Saudi Arabia to become the world’s
largest oil producer, and a net exporter by 2030.
Today, it seems farfetched. Let’s consider what happened and
what it says about the future. The IEA isn’t run by idiots and
indeed, oil production was rocking. According to the Energy
Information Administration (EIA), US crude output rose from 5.5
million barrels per day in 2010 to 7.5 million barrels in 2013, and
as 2016 began, to 9.2, , an increase of 3.7 million barrels per day
in what can only be considered the relative blink of an eye.
What happened? In short, the rise of the resource play. There is
no single definition of the term, which became fashionable about 10
years ago. The simplest description I could find is “an
accumulation of hydrocarbons known to exist over a large regional
area.” But the term also connotes a large area and low risk. So
it’s a prospect that is very likely to contain a lot of oil.
“Large deposits and low risk?” Wall Street loved it, and so did
the banks. Companies that were identified as resource plays began
trading at high multiples compared to their peers. Adding resources
was given priority over costs. In the past five years, American and
Canadian oil and gas companies borrowed more $1.3 trillion.
It worked very well, for two reasons: new technology and the
high oil price. Companies could develop previously unexploited
resources and enhance recovery and commerciality within existing
plays.
This approach changed the map. North Sea? The Middle East? Old
news. The “new oil patch” ran from Alberta, Canada, down through
the shale fields of North Dakota and South Texas to huge offshore
oil deposits found near Brazil.
What happened next? Well, we all know what happened next. Oil
prices tanked. It wasn’t a conspiracy. It wasn’t the Saudis. It was
us, and by that I mean the U.S.—American and Canadian producers
were adding millions of barrels a day in new production to world
markets at a time when global demand couldn’t absorb it. The surge
in Iraqi output added additional crude to the growing surplus and
combined with the slowdown in China and Europe and you have a
perfect glut. Supply simply exceeded demand.
As recently as June 2014, Brent crude, the international
benchmark blend, was selling at $114 per barrel. As 2015 began, it
had plunged to $55 per barrel.1 As of this writing, it’s even
lower, around $45.
Disaster ensued; big oil profits have plummeted; many smaller
companies have gone bankrupt; even a country—Venezuela—is going
belly-up, and Russia is struggling.
So who’s been hurt the most? Companies that packed their
portfolios with resource plays that rely on unconventional means of
extraction, such as hydro-fracking, tar sands, shale and deep-sea
drilling. The break-even point for tar sands can run as high as,
$80+ per barrel, with shale oil in the $50 to $60 a range. Workable
when oil fetches $90-100 per barrel, but not so much in today’s
range.
This isn’t just a protracted sell-off. It’s a new reality. In
our unstable world, a Middle East supply disruption could push oil
above $100 per barrel. But that is far-fetched, and even if it did
occur would likely be short- term. Big Oil isn’t counting on it.
The sector is focused on living in a world of $50 crude. “At an
average price of $53 per barrel of oil means the world’s 50 biggest
publicly traded companies in the industry can stop bleeding cash,
according to oilfield consultant Wood Mackenzie Ltd.”
Can oil prices stabilize at $60 or above? No one is certain, but
the oilfields that have been shuttered could come online quite
quickly, in as little as six months, with minimal additional capex.
So in essence, North American oil companies are acting as what
Bernhard Hartmann and Saji Sam call “quasi swing sustained price
increases. So, barring a catastrophe, the days of $70+ oil
are probably gone.
This “new normal” has engendered a new approach to exploration
and production (E&P) companies. This new approach looks
remarkably like an old approach: focus on more easily recoverable
resources and keep costs low by improving their field productivity,
utilizing seismic technology and trimming organizational costs.
Overcapacity in the oil services sector has significantly reduced
the cost of exploration and development.
Just as smaller companies led the way in conventional, a new
crop of E&P companies have targeted assets that can generate
cash flow at prices as low as $20 per barrel.
One such company is Petro River Oil (PTRC). Petro’s management
has nimbly assembled a diverse set of conventional oil & gas
assets. Its approach couldn’t be more in contrast with mainstream
E&P in the past decade—it has no shale plays, no debt and
F&D costs estimated at <$10 and a breakeven price of about
$20 or less. It currently has six projects at various stages of
exploration and development. As the assets are located in Oklahoma,
California and Western Europe, they aren’t exposed to geopolitical
risk. Petro’s 9 well drill program is fully-funded, it has an
extensive seismic databank, and has been shooting additional 3D
seismic data to de-risk drilling targets.
Management projects reserves of over 2 MMBoe by December 2016
while spending less than $1,000,000
PTRC, while accompanied by the attendant risks of E&P, is
well-positioned to make money in the new normal price range and has
none of the baggage of the big shale/high debt competitors in the
peer group. At around $3.00 per share, the company is trading at
what appears substantially below its potential, if the exploration
program results in even modest reserves.
Other companies pursuing similar strategies include Alvopetro
which is targeting lower risk development drilling on mature fields
and shallow conventional exploration opportunities. Alvopetro’s
assets are in Brazi.
A note: In spite of the ascendancy of renewables, we’ll continue
to be dependent on oil and gas for decades, and oil consumption
will continue to grow in the foreseeable future.
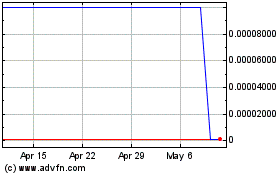
Petro River Oil (CE) (USOTC:PTRC)
Historical Stock Chart
From Mar 2024 to Apr 2024

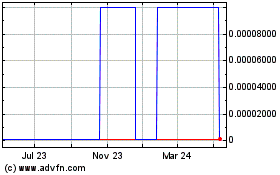
Petro River Oil (CE) (USOTC:PTRC)
Historical Stock Chart
From Apr 2023 to Apr 2024
