MARKET SNAPSHOT: U.S. Stocks Tumble Following Weak Economic Data
May 04 2016 - 10:03AM
Dow Jones News
By Ellie Ismailidou and Sara Sjolin, MarketWatch
Dow industrials drop over 120 points; private-payroll gains miss
expectations; productivity falls
U.S. stocks opened lower on Wednesday, as investors grappled
with a number of weaker-than-expected economic reports that
suggested the economy continues to grow at a slow pace.
The S&P 500 was down 13 points, or 0.6%, to 2,050, led by a
sharp drop in financial shares, down 1.1%.
The Dow Jones Industrial Average was down 125 points, or 0.7%,
to 17,624 shortly after the open, weighed by losses for Travelers
Cos. Inc.(TRV) and Goldman Sachs Group Inc.(GS), both down 1.2%
Meanwhile, the Nasdaq Composite began the session down 30
points, or 0.6%, at 4,733.
The ADP employment number for April
(http://www.marketwatch.com/story/adp-reports-private-sector-job-gains-slowed-in-april-2016-05-04)
came in at 156,000, well short of the 200,000 jobs expected,
showing that private payroll gains slowed markedly in April. The
report is seen as a precursor to the top-tier nonfarm-payrolls data
out on Friday
(http://www.marketwatch.com/story/if-the-economy-springs-back-jobs-and-auto-sales-will-lead-the-way-2016-05-01),
which are closely watched as they are seen as playing a big part in
determining the future path for Federal Reserve interest rates.
Meanwhile, the productivity of U.S. businesses and workers
(http://www.marketwatch.com/story/us-productivity-drops-1-in-first-quarter-2016-05-04)
fell by a 1% annual rate in the first quarter, marking the fourth
decline in the past six quarters.
On the bright side, the U.S. trade deficit shrank in March
(http://www.marketwatch.com/story/us-trade-deficit-sinks-17-in-march-to-404-billion-2016-05-04)
to its lowest level in more than a year, but the plunge still
reflected a tough climate for American exporters and more caution
on the part of consumers.
(END) Dow Jones Newswires
May 04, 2016 09:48 ET (13:48 GMT)
Copyright (c) 2016 Dow Jones & Company, Inc.
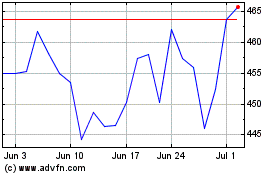
Goldman Sachs (NYSE:GS)
Historical Stock Chart
From Mar 2024 to Apr 2024

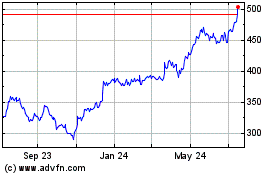
Goldman Sachs (NYSE:GS)
Historical Stock Chart
From Apr 2023 to Apr 2024
