CBOE Reports Higher Earnings, Revenue Thanks to Trading Shift
April 29 2016 - 9:20AM
Dow Jones News
CBOE Holdings Inc. said increased transaction fees pushed
first-quarter earnings and revenue higher, thanks to a shift in
trading volume toward higher-margin contracts.
Results, however, fell short of expectations.
Chicago-based CBOE owns the Chicago Board Options Exchange, the
world's largest options trading venue, and it exclusively lists
widely traded products including options on the S&P 500. The
exchange also owns the VIX, or Volatility Index, considered the
stock market's "fear gauge" that correlates with market
distress.
Like other exchange operators, the company generates most of its
revenue from transaction fees. Though CBOE said trading volume was
flat from a year earlier at 4.77 million contracts a day,
transaction fees jumped 14% thanks to a favorable mix shift.
Trading volume in higher-margin index options and futures contracts
rose 28% in the quarter, lifting the average revenue per contract
19%.
Higher transaction fees offset declines in other areas of the
business. Revenue from market data, a revenue source some
competitors are trying to beef up, slipped 0.5% to $8.0 million,
while access fees declined 3.2% to $13.2 million.
Chief Financial Officer Alan Dean highlighted CBOE's efforts to
control costs. "We plan to continue to be disciplined in managing
expenses while making prudent investments to strengthen and grow
our business," he said. In the first quarter, the company's
operating margin edged up to 49% from 48.7% in the year-ago
period.
In all, CBOE reported a profit of $49.2 million, or 60 cents a
share, up from $42.1 million, or 50 cents a share, a year earlier.
Excluding certain one-time items, earnings per share were 61
cents.
Revenue climbed 14% to $162.3 million. Analysts expected 62
cents a share on $165.6 million in revenue.
Shares in the company, up 13% over the past year, were inactive
during premarket trading.
Write to Lisa Beilfuss at lisa.beilfuss@wsj.com
(END) Dow Jones Newswires
April 29, 2016 09:05 ET (13:05 GMT)
Copyright (c) 2016 Dow Jones & Company, Inc.
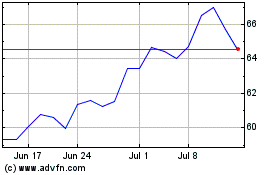
Citigroup (NYSE:C)
Historical Stock Chart
From Mar 2024 to Apr 2024

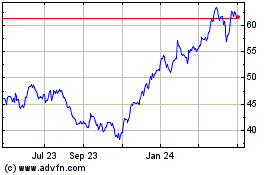
Citigroup (NYSE:C)
Historical Stock Chart
From Apr 2023 to Apr 2024
