U.S. Jobless Claims Fall 16,000 to 269,000
February 11 2016 - 9:20AM
Dow Jones News
WASHINGTON—The number of Americans filing for first-time
unemployment benefits fell last week, another sign of the domestic
job market's resilience in the face of economic turmoil
overseas.
Initial jobless claims, a proxy for layoffs across the U.S.,
fell by 16,000 to a seasonally adjusted 269,000 in the week ended
Feb. 6, the Labor Department said Thursday.
Economists surveyed by The Wall Street Journal had expected
280,000 new claims last week. Claims for the prior week were
unrevised at 285,000.
Jobless claims data tends to be volatile from week to week, but
have generally been falling since 2009 and have held at
historically low levels for months, consistent with ongoing job
creation. But despite last week's fall, the four-week moving
average of initial claims has steadily crept up since the end of
October, when it hit a postrecession low of 259,250.
Since then, it has risen by more than 20,000 to 281,250, a trend
Goldman Sachs economists called "more than just noise" in a recent
analyst note. Last week's figures are also considered to be free of
the seasonal volatility of the postholiday period, in which
companies may be laying off temporary hires like retail or
warehousing workers.
Job growth slowed in January, as employers added just 151,000
jobs, a sharp fall from 2015's monthly average of 228,000. That
robust job creation gave the Federal Reserve leeway to raise
interest rates for the first time in nearly a decade in December.
But January's weaker reading and continued turmoil in emerging
economies and financial markets have clouded the timeline for
further rate increases this year.
Thursday's report showed the number of continuing unemployment
benefit claims—those drawn by workers for more than a week—fell by
21,000 to 2,239,000 in the week ended Jan. 30. Continuing claims
are reported with a one-week lag. Some economists worry that low
claims figures signal a lack of dynamism in the labor market, or
could reflect a population of long-term unemployed that isn't
eligible to file new claims.
Write to Anna Louie Sussman at anna.sussman@wsj.com and Kate
Davidson at kate.davidson@wsj.com
(END) Dow Jones Newswires
February 11, 2016 09:05 ET (14:05 GMT)
Copyright (c) 2016 Dow Jones & Company, Inc.
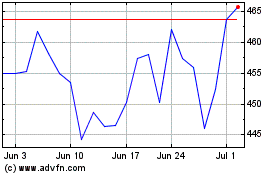
Goldman Sachs (NYSE:GS)
Historical Stock Chart
From Mar 2024 to Apr 2024

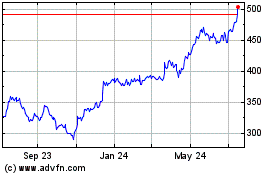
Goldman Sachs (NYSE:GS)
Historical Stock Chart
From Apr 2023 to Apr 2024
