By Ellie Ismailidou and Sara Sjolin, MarketWatch
Stocks on track for worst January in history; Goldman Sachs
shares close at lowest level in nearly 3 years
U.S. stocks ended a wild session sharply lower, but trimmed
heavier losses scored earlier in the session as a modest bounce off
session lows by crude-oil prices provided some relief.
The S&P 500 closed down 22 points, or 1.2%, at 1,859, after
earlier diving as low as 1,812.22, its lowest level since February
2014. The index closed at its lowest level since April 15, 2014,
breaking below its Aug. 25 closing low of 1867.61--a level viewed
as key technical support point for the index, suggesting further
moves lower may be ahead.
The Dow Jones Industrial Average closed down 249.28 points, or
1.6%, at 15,766.74, recovering from a 565-point-drop earlier on
Wednesday afternoon, its worst one-day point drop in the past 12
months. The blue-chip gauge posted its lowest settlement since Aug.
25 and is down 9.5% for the month, on track for its worst January
performance in history.
Wednesday's wild swings are indicative of a "very jittery
market" where sentiment "is prone to vicious swings," said Mike
Antonelli, equity sales trader at R.W Baird & Co.
"At some point selling exhausts itself. When stocks that are
punished very heavily are the first to start bouncing, it's an
indication that a lot of short covering was taking place in the
market," Antonelli said.
Earlier in the session, the index fell the farthest below its
200-day moving
(http://www.marketwatch.com/story/sp-500-drops-more-than-10-below-its-200-day-moving-average-2016-01-20)
average since the October 2011 correction, according to data
provided by FactSet. The gauge is down 9% for the month, on track
for it worst January performance in its history.
The energy sector was still the worst performer on the S&P
500, down 2.9% on the day and 13.3% since the beginning of the
year, led by Devon Energy Corp. (DVN), down 8% on the day.
The Nasdaq Composite erased most of a 145-point drop to close
5.26 points, or 0.1%, lower at 4,471.69.
The stock-market rout came as equities racked up sharp losses
world-wide, fueled by oil falling below $27
(http://www.marketwatch.com/story/oil-prices-hit-fresh-12-year-low-under-28-a-barrel-2016-01-20)
a barrel and worries over an economic slowdown in China and other
developing markets.
Biotech was the most notable example of such a reversal in a
battered sector. The iShares Nasdaq Biotechnology ETF (IBB) gained
2.8% on Wednesday, but was down 15.6% since the beginning of the
year.
A few strategists, including Jeffrey Gundlach, chief executive
of DoubleLine Capital, earlier pointed to margin calls as one of
the main drivers behind the bloodbath
(http://www.cnbc.com/2016/01/20/gundlach-declines-not-stopping-anytime-soon-suggest-margin-calls-taking-place.html).
Margin debt peaked in 2015 to its highest level in 20 years,
according to New York Stock Exchange data, and is closely
correlated with the S&P performance.
Including companies that reported Wednesday morning, 35 of the
46 companies on the S&P 500 that have reported quarterly
results have beat expectations, with 11 of 14 financials beating,
according to data from S&P Dow Jones Indices. Yet aggregate
earnings per share for the S&P 500 were estimated to drop
nearly 6% year-over-year, according to data from S&P Capital
IQ.
"Earnings will be the main issue that will make or break the
market. By this time next week we will be so deep into the earnings
[season] that you can't miss it," said Howard Silverblatt, senior
index analyst at S&P Dow Jones Indices.
Meanwhile, a flurry of economic data offered a mixed picture of
the U.S. economy, but did little to hearten the gloomy market
sentiment.
The U.S. consumer-price index dropped 0.1% in December,
(http://www.marketwatch.com/story/inflation-falls-again-in-december-cpi-finds-2016-01-20)
but core CPI, which excludes food and energy, rose 0.1%. Though the
headline number came in lower than expected, the core was in line
with economists' expectations. For all of 2015 inflation rose just
0.7%, the second slowest rate in 50 years.
Housing starts fell 2.5% last month
(http://www.marketwatch.com/story/housing-starts-fall-25-in-final-month-of-2015-2016-01-20),
missing economists' expectations, and indicating that home builders
cut back slightly on new construction in the final month of
2015.
Meanwhile, in Asia
(http://www.marketwatch.com/story/hong-kong-stocks-hit-312-year-low-japan-nears-bear-market-2016-01-19),
Japan's Nikkei slid into bear market territory, which marks a 20%
slump from a recent high. And in Europe, markets were hit across
the board, with the Stoxx Europe 600 index tumbling over 3% to
close at its lowest level since late 2014
(http://www.marketwatch.com/story/european-stocks-tumbling-toward-lowest-close-in-more-than-a-year-2016-01-20).
Read:China's problems now spilling into Hong Kong
(http://www.marketwatch.com/story/have-investors-lost-faith-in-hong-kong-as-well-as-in-china-2016-01-19)
Oil blues: The oil market rout weighed on U.S. oil companies,
with shares of Chevron Corp. (CVX) down 3%, Exxon Mobil Corp. (XOM)
off 4.2%, and Anadarko Petroleum Corp. (APC) 1% lower. Seadrill
Ltd. (SDRL.OS) slid 12.2%.
Other movers and shakers: International Business Machines Corp.
shares (IBM), retreated 4.9%, leading the Dow decliners, after the
company late Tuesday reported a drop in fourth-quarter earnings
(http://www.marketwatch.com/story/ibm-profit-falls-on-lower-revenue-2016-01-19-164854141).
Read:IBM needs software to save it from prolonged downfall
(http://www.marketwatch.com/story/ibm-needs-software-to-save-it-from-prolonged-downfall-2016-01-19)
Shares of Goldman Sachs Group Inc. (GS) slid 1.9%, falling to
the lowest level in nearly three years, after the Wall Street bank
reported a sharp slide in fourth-quarter profit
(http://www.marketwatch.com/story/goldman-sachs-profit-hurt-by-massive-settlement-2016-01-20).
Earnings were dented by the bank's agreement last week to pay the
largest regulatory penalty
(http://www.marketwatch.com/story/goldman-sachs-to-pay-record-5-billion-penalty-over-sale-of-mortgage-bonds-2016-01-15)
in its history over the sale of mortgage bonds.
U.S.-listed shares of Royal Dutch Shell PLC (RDSB.LN) dropped
5.4% after the oil giant forecast fourth-quarter profit fell as
much as 50%
(http://www.marketwatch.com/story/shell-profit-falls-up-to-50-as-oil-prices-slump-2016-01-20).
Netflix Inc. (NFLX) reversed most of its losses, to close down
0.1%, after the media-streaming company late Tuesday released
earnings that beat expectations
(http://www.marketwatch.com/story/netflix-shares-up-on-earnings-beat-company-predicts-modest-q1-2016-01-19).
Restaurant operator Brinker International Inc. (EAT) fell 3.3%
after its second-quarter revenue missed expectations
(http://www.marketwatch.com/story/brinker-international-second-quarter-revenue-misses-reaffirms-2016-guidance-2016-01-20).
Energy-infrastructure company Kinder Morgan Inc. (KMI) reports
earnings after the market closes.
Other markets: The dollar slid to a one-year low against the yen
(http://www.marketwatch.com/story/yen-hammers-away-at-dollar-as-investors-go-looking-for-safety-again-2016-01-20),
but briefly traded at an all-time high against the ruble . The buck
also rose to a 13-year high against the Canadian dollar,
(http://www.marketwatch.com/story/the-canadian-dollar-is-getting-crushed-2016-01-12)
dragged down by falling energy prices.
Read: Wednesday is make-or-break day for Brazil's currency
(http://www.marketwatch.com/story/wednesday-is-a-make-or-break-day-for-brazils-currency-2016-01-19)
Most metals declined, but gold rose 1.2% as the financial market
volatility spooked investors into perceived as havens. Treasury
yields plunged to a three-month low
(http://www.marketwatch.com/story/treasury-yields-fall-as-investors-flee-to-safety-2016-01-20)
as demand for U.S. government debt surged.
(END) Dow Jones Newswires
January 20, 2016 17:12 ET (22:12 GMT)
Copyright (c) 2016 Dow Jones & Company, Inc.
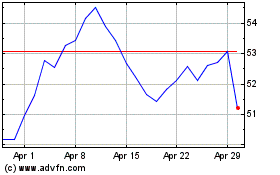
Devon Energy (NYSE:DVN)
Historical Stock Chart
From Mar 2024 to Apr 2024

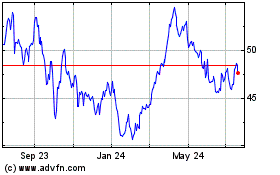
Devon Energy (NYSE:DVN)
Historical Stock Chart
From Apr 2023 to Apr 2024
