UNITED STATES
SECURITIES AND EXCHANGE COMMISSION
Washington, D.C. 20549
FORM 8-K
CURRENT REPORT
Pursuant to Section 13 or 15(d) of
The
Securities Exchange Act of 1934
Date of Report (Date of earliest event
reported): January 11, 2016
ANI PHARMACEUTICALS, INC.
(Exact name of
registrant as specified in its charter)
Delaware
(State or other jurisdiction of
incorporation) |
001-31812
(Commission
File Number) |
58-2301143
(I.R.S. Employer
Identification Number) |
|
210 Main Street West
Baudette, Minnesota
(Address of principal executive offices)
|
56623
(Zip Code) |
Registrant’s telephone number,
including area code: (218) 634-3500
Check the appropriate box below if the Form
8-K filing is intended to simultaneously satisfy the filing obligation of the registrant under any of the following provisions
(see General Instruction A.2. below):
| ¨ | Written communications pursuant to Rule 425 under the
Securities Act (17 CFR 230.425) |
| ¨ | Soliciting material pursuant to Rule 14a-12 under the
Exchange Act (17 CFR 240.14a-12) |
| ¨ | Pre-commencement communications pursuant to Rule 14d-2(b)
under the Exchange Act (17 CFR 240.14d-2(b)) |
| ¨ | Pre-commencement communications pursuant to Rule 13e-4(c)
under the Exchange Act (17 CFR 240.13e-4(c)) |
Item 7.01 Regulation FD Disclosure.
On January
11, 2016, ANI Pharmaceuticals, Inc. (the “Company,” “we” or “us”) posted to its website its
January 2016 Corporate Presentation. We may use this presentation in our communications or at conferences. The presentation is
available on our website, www.anipharmaceuticals.com, and is attached to this Current Report on Form 8-K as Exhibit 99.1 and incorporated
into this Item 7.01 by reference.
In accordance
with General Instruction B.2 of Form 8-K, the information in this Current Report on Form 8-K, including Exhibit 99.1, shall not
be deemed to be “filed” for purposes of Section 18 of the Securities Exchange Act of 1934, as amended (the “Exchange
Act”), or otherwise subject to the liabilities of that section, and shall not be incorporated by reference into any registration
statement or other document filed under the Securities Act of 1933, as amended, or the Exchange Act, except as shall be expressly
set forth by specific reference in such filing.
Forward-Looking Statements
Certain statements contained in the presentation slides furnished with this report contain forward-looking statements within the
meaning of the safe harbor provisions of the Private Securities Litigation Reform Act of 1995. Such statements include, but are
not limited to, statements about future operations, products, financial position, operating results, prospects, pipeline or potential
markets therefor, and other statements that are not historical in nature, particularly those that utilize terminology such as “anticipates,”
“will,” “expects,” “plans,” “potential,” “future,” “believes,”
“intends,” “continue,” other words of similar meaning, derivations of such words, and the use of future
dates.
Uncertainties and risks may cause our actual results to be materially
different than those expressed in or implied by such forward-looking statements. Uncertainties and risks include, but are not limited
to, the risk that we may face with respect to importing raw materials, increased competition, delays or failure in obtaining product
approval from the U.S. Food and Drug Administration ("FDA"), general business and economic conditions, market trends,
product development, regulatory and other approvals and marketing.
More detailed information on these and additional
factors that could affect our actual results are described in our filings with the Securities and Exchange Commission, including
our most recent annual report on Form 10-K and quarterly reports on Form 10-Q, as well as our proxy statement/prospectus, filed
with the Securities and Exchange Commission on April 24, 2015. The forward-looking statements contained in this document are made
only as of the date of this document. We undertake no obligation to update or revise any forward-looking statement, whether as
a result of new information, future events or otherwise.
Item 9.01. Financial Statements and
Exhibits.
(d) Exhibits
| Exhibit No. |
|
Exhibit |
| 99.1 |
|
ANI Pharmaceuticals, Inc. Corporate Presentation January 2016 |
| |
|
|
| |
|
|
SIGNATURES
Pursuant to the requirements of the Securities
Exchange Act of 1934, the registrant has duly caused this report to be signed on its behalf by the undersigned hereunto duly authorized.
| |
|
ANI PHARMACEUTICALS, INC. |
| |
|
|
| Date: January 11, 2016 |
By: |
|
| |
|
/s/ Charlotte C. Arnold |
| |
|
Charlotte C. Arnold |
| |
|
Vice President, Finance and Chief Financial Officer |
Exhibit 99.1

A Specialty Pharmaceutical Company NASDAQ: ANIP GENERIC AND BRANDED PRESCRIPTION DRUG PRODUCTS Corporate Presentation January 2016

Forward - Looking Statements To the extent any statements made in this presentation deal with information that is not historical, these are forward - looking statements within the meaning of the Private Securities Litigation Reform Act of 1995. Such statements include, but are not limited to, statements about price increases, the Company’s future operations, products financial position, operating results and prospects , the Company’s pipeline or potential markets therefore, and other statements that are not historical in nature, particularly those that utilize terminology such as “anticipates,” “will,” “expects,” “plans,” “potential,” “future,” “believes,” “intends,” “continue,” other words of similar meaning, derivations of such words and the use of future dates. Uncertainties and risks may cause the Company’s actual results to be materially different than those expressed in or implied by such forward - looking statements. Uncertainties and risks include, but are not limited to, the risk that the Company may face with respect to importing raw materials; increased competition; delays or failure in obtaining product approval from the U.S. Food and Drug Administration; general business and economic conditions; market trends; products development; regulatory and other approvals and marketing. More detailed information on these and additional factors that could affect the Company’s actual results are described in the Company’s filings with the Securities and Exchange Commission, including its most recent annual report on Form 10 - K and quarterly reports on Form 10 - Q, as well as its proxy statement. All forward - looking statements in this presentation speak only as of the date of this presentation and are based on the Company’s current beliefs, assumptions, and expectations. The Company undertakes no obligation to update or revise any forward - looking statement, whether as a result of new information, future events or otherwise. 2

3 ANI Mission Statement ANI Pharmaceuticals is an integrated specialty pharmaceutical company developing, manufacturing and marketing branded and generic prescription pharmaceuticals. We focus on niche and high barrier to entry opportunities including controlled substances, anti - cancer (oncolytics), hormones and steroids, and complex formulations.

ANI Overview – Positioned for Growth ANI Today ▪ Current business – For the quarter ended September 30, 2015: $20.0 million total net revenues □ $15.1 million Generic Rx product revenues +48% y/y □ $2.3 million Brand Rx product revenues - 53% y/y □ $2.6 million c ontract manufacturing/services revenues +9% y/y □ Growth of 15% quarter/quarter ▪ Guidance for 2015 (1) – Net revenues of $75.5 million to $78.3 million – Adjusted non - GAAP EBITDA (2) of $43.3 to $45.4 million – Adjusted non - GAAP net income per diluted share (2) of $2.83 to $2.96 ▪ 85 products in development; total current market $5.7 billion (3) (1) November 3, 2015 press release (2) See Appendix A for US GAAP reconciliations (3) Based on Company estimates, and recent IMS and NSP Audit data 4

5 ANI History and Highlights 2013 Completed merger with BioSante Pharmaceuticals and obtains NASDAQ Global Market listing (NASDAQ: ANIP), June 2013 2013 Announced agreement to acquire 31 previously marketed generic products from Teva for $12.5 million and a percentage of future gross profits, December 2013 2014 Closed public offering of common shares netting $46.8 million, March 2014 2014 Acquired Vancocin ® and related assets for $11 million, August 2014 2015 Acquired approved ANDA for Flecainide tablets from Teva for $4.5 million and a percentage of future gross profits, March 2015 2014 Acquired Lithobid ® for $12 million, July 2014 2014 Closed public offering of $143.8 million of convertible debt with simultaneous bond hedge and warrant transactions, December 2014 2016 Acquired two NDAs for Corticotrophin from Merck for $75 million and a percentage of future net sales, January 2016 2015 Acquired 22 previously marketed generic products from Teva for $25 million and a percentage of future gross profits, July 2015 2015 Acquired approved NDA for Testosterone Gel from Teva, May 2015

6 Sales and Marketing Overview

ANI Historical Revenue Growth 7 $s in millions 39% C ost of sales as a percentage of net revenues, excluding depreciation and amortization 42% 43% 33% 21% 16%

ANI Generic Rx Product Portfolio Generic Products Market Share (1) Competitors (2) EE/MT Tablets 55% 3 Fluvoxamine Tablets 58% 3 HC Enema 80% 2 Metoclopramide Solution 22% 2 Opium Tincture 74% 3 Methazolamide Tablets 40% 3 Etodolac Capsules 19% 3 Propafenone Tablets 3% 4 Oxycodone Solution Launched 10/15 4 Vancomycin Capsules Launched 11/15 5 Nimodipine Capsules Launched 12/15 3 Flecainide Tablets Launched 12/15 5 8 (1) Based on Company estimates, and recent IMS and NSP Audit data (2) Including ANI Pharmaceuticals 3 Q 2015 Net Sales: $15.1M
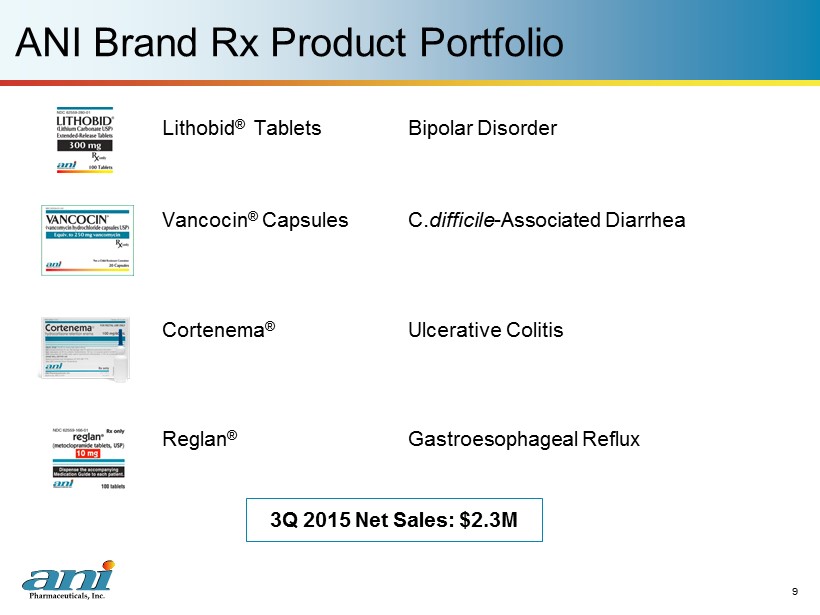
ANI Brand Rx Product Portfolio 9 Lithobid ® Tablets Bipolar Disorder Vancocin ® Capsules C. difficile - Associated Diarrhea Cortenema ® U lcerative Colitis Reglan ® Gastroesophageal Reflux 3Q 2015 Net Sales: $2.3M

ANI Contract Manufacturing and Other 10 Current Business ▪ Four customers – Seven products and seventeen SKUs – Contract manufacturing and contract packaging 3Q 2015 Net Sales: $2.6M

11 Business Development / Product Development Overview

Business Development Activity 12 $1.1 $0.1 G e n e r i c s GENERIC PRODUCT (Partnership with Dexcel) FDF Partnership Private P TEVA ANDA BASKET 2 (22 previously approved ANDAs) TEVA ANDA BASKET 1 (31 previously approved ANDAs) Total $142.2 FDF Partnership Private Acquisition Public P P P $25.0 P $12.5 Acquisition Public P P Acquisition Private P P P $4.5 US Distr Rights Private P P FLECAINIDE (flecainide tablets) P $1.0 IDT PARTNERSHIP (18 previously approved ANDAs) P P $12.0 NIMODIPINE & GENERIC PRODUCT (Partnership with Sofgen) VANCOCIN (vancomycin hydrochloride capsules) LITHOBID (lithium carbonate tablets) Acquisition Private Acquisition Private P P $11.0 P $0.0 Acquisition Private P $75.0 TESTOSTERONE GEL (testosterone gel satchets) ACQUISITION COST ($M) B r a n d s Acquisition Public P P CORTICOTROPIN DEAL STRUCTURE DEAL SOURCE STRATEGY STATEMENT ANI MANUF PREVIOUSLY APPROVED (corticotropin)

13 ANI Product Development Pipeline 85 p roducts in development, total combined current market: $5.7 billion (1) ▪ 55 products were acquired and of those, ANI believes 48 can be commercialized based on either a CBE - 30 or PAS ▪ ANI anticipates launching eight products by the end of 2016: (1) Based on Company estimates, and recent IMS and NSP Audit data (2) FDA’s Target Action Date, per FDA communications Product Total Annual Market Size (1) Estimated Launch FDA Approvals Required Anti - cancer drug, ( TAD (2) 2/26/2016) Undisclosed Q1 2016 ANDA Dexcel product $47M Q2 2016 ANDA Five ANDAs acquired in July 2015 $264M Q4 2016 CBE - 30 Testosterone 1% gel $370M Q4 2016 CBE - 30

14 Manufacturing Overview

15 ANI Manufacturing – Main Street Facility Location: Baudette , Minnesota ▪ 52,000 square feet of manufacturing , packaging, and warehouse facilities ▪ Rx solutions , suspensions , topicals , tablets , and capsules ▪ DEA - licensed for Schedule II controlled substances ▪ 17,000 square feet of laboratory space for product development and analytical testing

16 ANI Manufacturing – IDC Road Facility Location: Baudette, Minnesota ▪ Fully - contained h igh potency facility with capabilities to manufacture h ormone , steroid , and oncolytic products ▪ 47,000 square feet of manufacturing and packaging, and warehouse facilities ▪ 100 nano - gram per eight - hour weighted average maximum exposure limit to ensure employee safety ▪ DEA Schedule IIIN capability

ANI Summary ANI is an integrated specialty generic pharmaceutical firm with: ▪ Profitable base business generating organic growth – 2015 Annual guidance (1) □ Net revenues of $75.5 million to $78.3 million □ Adjusted non - GAAP EBITDA of $43.3 million to $45.4 million □ Adjusted non - GAAP Net Income Per Diluted Share of $2.83 to $2.96 ▪ Well capitalized balance sheet with $80 million in cash ▪ Experienced management team ANI is focused on: ▪ Partnerships/strategic alliances ▪ Accretive acquisitions ▪ Internal product development 17 (1) November 3, 2015 press release

18 Appendix A

U.S. GAAP Reconciliations 19 2015 2014 2015 2014 Operating Income $8,451 $8,199 $26,432 $9,234 Add back Depreciation and amortization 2,047 1,187 4,789 2,596 Add back Stock-based compensation 1,120 692 2,717 2,719 Adjusted non-GAAP EBITDA $11,618 $10,078 $33,938 $14,549 ANI Pharmaceuticals, Inc. and Subsidiary Adjusted non-GAAP EBITDA Calculation and US GAAP to Non-GAAP Reconciliation (unaudited, in thousands) Three months ended September 30, Nine months ended September 30,

U.S. GAAP Reconciliations 20 Three months ended September 30, 2015 Nine months ended September 30, 2015 Net Income 4,559$ $ 12,499 Add back Tax provision 1,098 5,733 Depreciation and amortization expense 2,047 4,789 Non-cash interest expense 1,721 5,109 Stock-based compensation 1,120 2,717 Less Current portion of tax provision (1,252) (5,444) Adjusted non-GAAP Net Income 9,293$ 25,403$ Diluted Weighted-Average Shares Outstanding 11,563 11,559 Adjusted non-GAAP Net Income Per Diluted Share 0.80$ 2.20$ ANI Pharmaceuticals, Inc. and Subsidiary Adjusted non-GAAP Net Income and Adjusted non-GAAP Net Income per Diluted Share Reconciliation (unaudited, in thousands, except per share amounts)
ANI Pharmaceuticals (NASDAQ:ANIP)
Historical Stock Chart
From Mar 2024 to Apr 2024

ANI Pharmaceuticals (NASDAQ:ANIP)
Historical Stock Chart
From Apr 2023 to Apr 2024
