The ETF industry continues to evolve, as more unique products
make their debut; however, the exchange-traded landscape is still
dominated by passive, index-based instruments. This shouldn’t come
as a surprise, because after all, investors have embraced this
product wrapper for its unparalleled ease-of-use and
cost-efficiency, with many of these funds earning
themselves the reputation as “core holdings” in countless
portfolios. On the other end of the spectrum, actively-managed ETFs
haven’t exactly been in the spotlight as many criticize their
above-average expense ratios and failure to deliver exceptional
returns. While this may be true for some, it’s certainly not the
case when it comes to the TrimTabs Float Shrink ETF (TTFS).
Inside TTFS’s Strategy
TTFS takes an entirely different approach to security selection
when compared to other actively-managed equity ETFs or even
so-called “smart beta” products; for the most part, these other
funds start with a broad universe of securities, apply a number of
fundamental filters, and ultimately end up with a basket of
holdings that is more-or-less a trimmed down version of some
broader index out there. While there is nothing inherently wrong
with this approach, it does help to illustrate why TTFS is unique
[see also TrimTabs Insights: What "Float-Shrink" Means to
Investors].
The TrimbTabs Float Shrink ETF separates itself from the pack in
that it relies on supply and demand criteria to select its
underlying securities rather than fundamental metrics, such as
dividend yield or earnings growth. At the root of TTFS’s
methodology is a liquidity-based approach that revolves around
three main criteria:
 1. Float Shrink – the
management team tracks the number of shares outstanding for
more than 3,000 securities. This is where supply-demand theory
kicks in; securities with a decreasing number of shares
outstanding, or a shrinking float, are selected as candidates
because all else being equal, the same amount of money chasing a
fewer number of shares should translate into price
appreciation.
2. Profitability – TTFS does employ some fundamental screening
criteria; for starters, a company’s profitability as measured by
free cash flow is considered. The more cash flow positive a stock
is, the better, since that hints at a potential uptick in
demand for that security.
3. Leverage Ratio – The management team also looks to avoid
companies with fragile balance sheets; to do so, TTFS aims to focus
on securities with a stable leverage ratio.
In summary, TTFS’s strategy is actually quite straightforward;
the management team aims to select securities with a contracting
supply, as evidenced by a decreasing number of shares outstanding,
and those that have the potential to see an increase in demand, as
evidenced by increasing profitability and a stable leverage ratio.
Simply put, if supply is decreasing and demand is increasing,
logic points to higher prices.
Under the Hood of TTFS
When all is said and done, TTFS is left with 100 securities from
a starting universe of approximately 3,000. The securities that
make the cut are those that boast the most favorable of all three
criteria outlined in the strategy section above. Aside from
employing such a rigorous screening methodology, TFFS’s underlying
portfolio also separates itself from many other funds in the equity
space in that its equal-weighted rather than market
capitalization-weighted. In essence, every security
receives roughly the same allocation, which results in a tilt
towards small- and mid-cap stocks that might otherwise be more
neglected when it comes to allocations in other market cap-weighted
funds [see also Comparing Alternative Weighting Methodologies].
Digging deeper, let’s see what made the cut in TTFS; keep in
mind however that because the portfolio is actively-managed, it’s
allocations are bound to evolve over time and the holdings
are re-balanced on a monthly basis.
At the time of writing, some of the top holdings in TTFS
include: Allied World Assurance (AWH), Ross Stores (ROST), Axis
Capital Holdings (AXS), Expeditors International (EXPD), and TJX
Companies (TJX). In terms of sectors, TTFS holds the biggest
allocations in the Information Technology and Consumer
Discretionary sectors, at around 20% each, while Healthcare,
Industrials, and Financials make up the next biggest chunks.
Overall, because of its rigorous screening coupled with
an equal-weighted approach, this ETF’s underlying
portfolio is well-balanced.
Considerations for TTFS’s Performance
Investors should note that, generally, TTFS’s performance will
be very similar to the broader U.S. equity market. As an
actively-managed product, this ETF’s performance should be compared
to its stated benchmark, which is the Russell 3000 Index. Below,
let’s consider how this ETF has performed versus the iShares
Russell 3000 ETF (IWV) since its inception on October 5th of
2011 through mid-October of 2014:
 Over the years, TTFS has managed to
return approximately 46%, outperforming the Russell 3000 ETF, which
has returned approximately 34% in that same time frame. While it’s
true that TTFS is more expensive, charging 0.99% in management fees
compared to IWV’s 0.20%, this wide of a margin in performance since
it debuted is enough to make you forget about its steeper expense
ratio [see The Cheapest ETF for Every Investment
Objective].
How to Use TTFS in a Portfolio
In light of TTFS’s above-average expense ratio, it’s difficult
to recommend this as a core holding over the long-haul, especially
for cost-conscious investors. With that being said, those that lack
U.S. equity exposure and find the liquidity-based approach
compelling (and the impressive track record thus far) may consider
this is a viable alternative to other passive, index-based
equity funds.
All in all, TTFS is perhaps best utilized as a tactical holding
for those looking to build out their equity exposure. For some,
this can certainly be a core holding; however, the actively-managed
approach does introduce a degree of risk that may steer away more
conservative investors, and especially those looking to minimize
costs.
The Bottom Line
The methodology employed by TTFS makes it one of the most
unique ETFs on the market; more importantly, its impressive track
record should serve as a testament that actively-managed
products can in fact deliver stellar results that are worth the
higher management fees. For anyone looking to diversify their
equity exposure with a one-of-a-kind strategy, TTFS most certainly
warrants a closer look.
Follow me on Twitter @Sbojinov
[For more ETF analysis, make sure to
sign up for our free ETF newsletter]
Disclosure: No positions at time of
writing.
Click here to read the original article on ETFdb.com.
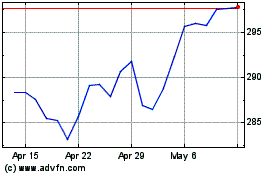
iShares Russell 3000 (AMEX:IWV)
Historical Stock Chart
From Mar 2024 to Apr 2024

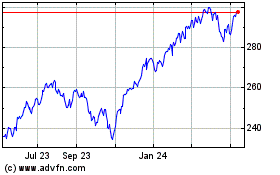
iShares Russell 3000 (AMEX:IWV)
Historical Stock Chart
From Apr 2023 to Apr 2024
