|
|
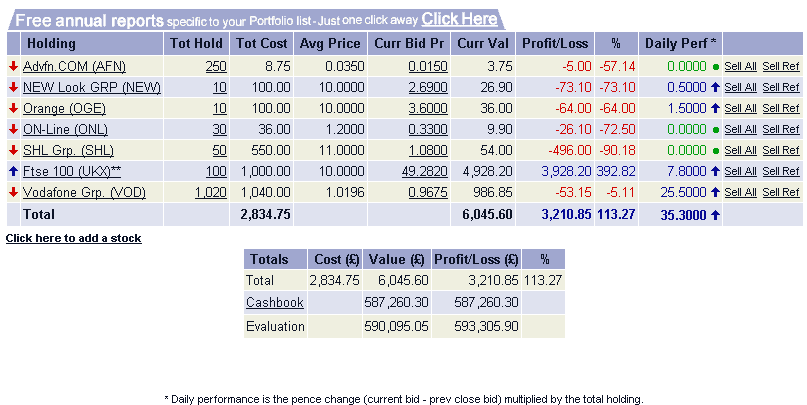
SummarySummary displays all the current holdings in your portfolio.
Summary lists all the companies in which you are a share holder. You may have bought shares in the same company at different times at different prices; summary shows the accumulated values of all the trades in a single company.
To see a break down of the individual share holdings within any one company click on the figure in the ‘Tot Hold’ column; this will take you to the ‘Holdings’ page. The ‘Holdings’ page will give you a break down all the trades you have recorded in that company.
At the bottom of the page the summary page iterates the overview of the portfolio.
You also make sell transactions from this page.

- Main summary table
Arrow column
The arrow column at the front of the row indicates whether the share has gone up or down in value against your costprice.
Holding
The name and epic of the company share holding.
Clicking on the company name will take you to the fundamental information for that company.
Tot Hold
The total number of shares, you have in that company.
Click on the figure in the Tot Hold column to see the breakdown your trades in that stock.
Tot Cost
The cost of all the shares you have bought in that company including brokers charges
Avg Price
The total cost of all the shares you have bought in that company including charges averaged across the number of shares purchased.
You may have bought shares in one company at different times and different prices. The average price adds together the cost of all those separate trades dividing them by the total number of shares bought in that company. Click on the ‘Tot Hold’ figure to see a break down of purchases in that holding.
Curr Bid Pr
The current bid price of that company‘s shares (15 min delayed)
Clicking on a bid price on summary page will take you to a quote screen for that share (which will be real-time)
Curr Val
The current value of your holding in that company stock against it
Number of shares in holding multiplied by the current bid price
Profit/loss
The difference between the "Total Cost" of those shares and they‘re estimated value at current bid price (15 min delayed).
%
This shows the percentage change in the value of the holding.
The percentage change which is measured is the difference between the total cost price and their current estimated value at the current bid price (15 min delayed).
Daily Perf
The change in value of the share price on the day against it’s opening price.
Totals summary table
Total cost:
The total cost of purchasing share holding including brokers charges
Total Val
The current value of all share holdings based on the current bid price.
Total Profit/loss
The difference between the total cost of all the holdings and the total price of all the shares in your portfolio if you sold them at the current bid price.
Total %
The percentage change in value between (Total cost) & (Total Value (based on current Bid price))
Cashbook Value
The balance of the cashbook
|
|